Public Cloud Jobs in London

Public Cloud
England > London

The table below looks at the prevalence of the term Public Cloud in permanent job vacancies in London. Included is a benchmarking guide to the salaries offered in vacancies that cited Public Cloud over the 6 months leading up to 13 May 2025, comparing them to the same period in the previous two years.

6 months to
13 May 2025
Same period 2024 Same period 2023
Rank 292 262 99
Rank change year-on-year -30 -163 +113
Permanent jobs citing Public Cloud 108 273 1,152
As % of all permanent jobs advertised in London 0.83% 1.15% 3.35%
As % of the Miscellaneous category 1.88% 2.85% 7.27%
Number of salaries quoted 64 225 533
10th Percentile £53,750 £51,250 £51,416
25th Percentile £72,500 £62,500 £61,180
Median annual salary (50th Percentile) £80,000 £77,500 £80,000
Median % change year-on-year +3.23% -3.13% -11.11%
75th Percentile £107,500 £105,000 £105,000
90th Percentile £140,000 £120,000 £125,000
England median annual salary £75,000 £67,500 £75,000
% change year-on-year +11.11% -10.00% -6.25%

All Generic Skills
London

Public Cloud falls under the General and Transferable Skills category. For comparison with the information above, the following table provides summary statistics for all permanent job vacancies requiring generic IT skills in London.

Permanent vacancies with a requirement for generic IT skills 5,730 9,569 15,856
As % of all permanent jobs advertised in London 44.06% 40.44% 46.13%
Number of salaries quoted 3,204 6,785 10,735
10th Percentile £41,750 £37,500 £44,192
25th Percentile £56,250 £51,532 £56,250
Median annual salary (50th Percentile) £80,000 £75,000 £75,000
Median % change year-on-year +6.67% - -
75th Percentile £110,000 £100,000 £100,000
90th Percentile £137,125 £128,750 £122,500
England median annual salary £60,000 £55,000 £65,000
% change year-on-year +9.09% -15.38% +4.00%

Public Cloud
Job Vacancy Trend in London

Job postings citing Public Cloud as a proportion of all IT jobs advertised in London.
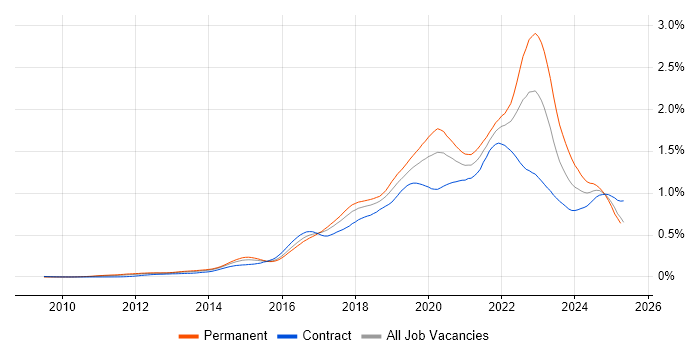
Job vacancy trend for Public Cloud in London

Public Cloud
Salary Trend in London

3-month moving average salary quoted in jobs citing Public Cloud in London.

Salary trend for Public Cloud in London

Public Cloud
Salary Histogram in London

Salary distribution for jobs citing Public Cloud in London over the 6 months to 13 May 2025.

Salary histogram for Public Cloud in London

Public Cloud
Job Locations in London

The table below looks at the demand and provides a guide to the median salaries quoted in IT jobs citing Public Cloud within the London region over the 6 months to 13 May 2025. The 'Rank Change' column provides an indication of the change in demand within each location based on the same 6 month period last year.

Location Rank Change
on Same Period
Last Year
Matching
Permanent
IT Job Ads
Median Salary
Past 6 Months
Median Salary
% Change
on Same Period
Last Year
Live
Jobs
Central London +17 25 £90,000 +33.33% 14
West London +23 3 £49,000 -42.35% 2
Public Cloud
England

Public Cloud
Co-occurring Skills and Capabilities in London by Category

The follow tables expand on the table above by listing co-occurrences grouped by category. The same employment type, locality and period is covered with up to 20 co-occurrences shown in each of the following categories:

Application Platforms
1 8 (7.41%) Microsoft Exchange
2 4 (3.70%) IIS
3 3 (2.78%) Apache
3 3 (2.78%) SharePoint
4 2 (1.85%) nginx
5 1 (0.93%) Jetty
5 1 (0.93%) Tomcat
Applications
1 8 (7.41%) Microsoft Excel
1 8 (7.41%) MS Visio
Business Applications
1 2 (1.85%) SAP S/4HANA
1 2 (1.85%) SimCorp Dimension
1 2 (1.85%) Sparx Enterprise Architect
2 1 (0.93%) Cloudability
2 1 (0.93%) SAP CO
2 1 (0.93%) SAP FI
2 1 (0.93%) SAP FI/CO
Cloud Services
1 73 (67.59%) AWS
2 59 (54.63%) Azure
3 56 (51.85%) GCP
4 23 (21.30%) PaaS
5 20 (18.52%) SaaS
6 19 (17.59%) Pulumi
7 18 (16.67%) Microsoft 365
8 15 (13.89%) IaaS
9 11 (10.19%) Entra ID
10 7 (6.48%) AWS CloudFormation
11 6 (5.56%) Serverless
12 5 (4.63%) Amazon S3
12 5 (4.63%) AWS CloudTrail
12 5 (4.63%) OpenShift
13 4 (3.70%) AWS Lambda
14 3 (2.78%) Amazon CloudWatch
14 3 (2.78%) Amazon GuardDuty
14 3 (2.78%) Anthos
14 3 (2.78%) Cloud Computing
14 3 (2.78%) Virtual Private Cloud
Communications & Networking
1 20 (18.52%) Firewall
2 16 (14.81%) DNS
3 13 (12.04%) DHCP
4 8 (7.41%) Cisco IOS
4 8 (7.41%) FTP
4 8 (7.41%) IPv4
4 8 (7.41%) PBX
4 8 (7.41%) SAN
4 8 (7.41%) SD-WAN
4 8 (7.41%) SMTP
4 8 (7.41%) Structured Cabling
4 8 (7.41%) VLAN
4 8 (7.41%) WAN
5 7 (6.48%) LAN
6 5 (4.63%) Cisco ISE
6 5 (4.63%) Ethernet
7 4 (3.70%) Network Security
7 4 (3.70%) TCP/IP
7 4 (3.70%) VPN
8 3 (2.78%) Cisco ASA
Database & Business Intelligence
1 11 (10.19%) Amazon RDS
2 5 (4.63%) SQL Server
3 3 (2.78%) Big Data
4 2 (1.85%) Amazon Athena
4 2 (1.85%) Amazon Aurora
4 2 (1.85%) Amazon Redshift
4 2 (1.85%) Flink
4 2 (1.85%) MongoDB
5 1 (0.93%) Amazon QuickSight
5 1 (0.93%) Elasticsearch
5 1 (0.93%) Hazelcast
5 1 (0.93%) MySQL
5 1 (0.93%) PostgreSQL
5 1 (0.93%) Power BI
5 1 (0.93%) Redis
5 1 (0.93%) Tableau
Development Applications
1 13 (12.04%) Jenkins
2 9 (8.33%) Git
3 5 (4.63%) JIRA
4 4 (3.70%) CircleCI
5 3 (2.78%) GitLab
6 1 (0.93%) Artifactory
6 1 (0.93%) Jaeger
6 1 (0.93%) JUnit
6 1 (0.93%) Selenium
6 1 (0.93%) Sonatype Nexus
6 1 (0.93%) TeamCity
6 1 (0.93%) Vagrant
General
1 36 (33.33%) Finance
2 26 (24.07%) Social Skills
3 9 (8.33%) Law
3 9 (8.33%) Telecoms
4 8 (7.41%) Banking
5 6 (5.56%) Games
6 4 (3.70%) Analytical Skills
6 4 (3.70%) Back Office
7 3 (2.78%) iGaming
7 3 (2.78%) Legal
7 3 (2.78%) Marketing
7 3 (2.78%) Publishing
7 3 (2.78%) Retail
8 2 (1.85%) Financial Institution
8 2 (1.85%) Inclusion and Diversity
8 2 (1.85%) Public Sector
9 1 (0.93%) Electronics
9 1 (0.93%) Front Office
9 1 (0.93%) Organisational Skills
9 1 (0.93%) Presentation Skills
Job Titles
1 28 (25.93%) Architect
2 24 (22.22%) Senior
3 19 (17.59%) Platform Engineer
4 13 (12.04%) Cloud Engineer
5 12 (11.11%) Consultant
6 11 (10.19%) DevOps Engineer
6 11 (10.19%) Infrastructure Engineer
7 10 (9.26%) Security Architect
7 10 (9.26%) Senior Cloud Engineer
8 9 (8.33%) DevOps Platform Engineer
8 9 (8.33%) Junior
8 9 (8.33%) Junior Linux Engineer
8 9 (8.33%) Linux Engineer
9 8 (7.41%) Cloud Architect
9 8 (7.41%) Infrastructure Consultant
9 8 (7.41%) Network Architect
9 8 (7.41%) Senior Consultant
9 8 (7.41%) Senior Infrastructure Consultant
10 7 (6.48%) AWS Architect
10 7 (6.48%) Infrastructure Architect
Libraries, Frameworks & Software Standards
1 9 (8.33%) Node.js
2 7 (6.48%) Kafka
3 5 (4.63%) JSON
4 4 (3.70%) ARM Templates
4 4 (3.70%) Middleware
5 3 (2.78%) REST
6 2 (1.85%) .NET
6 2 (1.85%) boto
6 2 (1.85%) GraphQL
6 2 (1.85%) gRPC
6 2 (1.85%) SAML
7 1 (0.93%) AngularJS
7 1 (0.93%) Elastic Stack
7 1 (0.93%) FastAPI
7 1 (0.93%) Flask
7 1 (0.93%) LAPP Stack
7 1 (0.93%) OpenTelemetry
7 1 (0.93%) pytest
7 1 (0.93%) React
7 1 (0.93%) SAP Fiori
Miscellaneous
1 19 (17.59%) Data Centre
2 14 (12.96%) Management Information System
3 13 (12.04%) Cloud Native
3 13 (12.04%) Private Cloud
4 12 (11.11%) Hybrid Cloud
5 8 (7.41%) Distributed Systems
6 5 (4.63%) Product Ownership
7 4 (3.70%) Data Structures
8 3 (2.78%) Mobile Games
8 3 (2.78%) Sports Betting
9 2 (1.85%) Algorithms
9 2 (1.85%) Reference Data
9 2 (1.85%) Replication
9 2 (1.85%) Security Posture
10 1 (0.93%) Enterprise Cloud
10 1 (0.93%) Enterprise Software
10 1 (0.93%) Enterprise Storage
10 1 (0.93%) Hedge funds
10 1 (0.93%) Onboarding
10 1 (0.93%) Self-Motivation
Operating Systems
1 40 (37.04%) Linux
2 32 (29.63%) Windows
3 13 (12.04%) Windows Server
4 9 (8.33%) Windows 10
5 8 (7.41%) Android
6 2 (1.85%) Unix
7 1 (0.93%) Windows Server 2012
7 1 (0.93%) Windows Server 2016
7 1 (0.93%) Windows Server 2019
Processes & Methodologies
1 49 (45.37%) Infrastructure as Code
2 46 (42.59%) CI/CD
3 37 (34.26%) DevOps
4 25 (23.15%) Agile
5 22 (20.37%) Platform Engineering
5 22 (20.37%) Roadmaps
6 21 (19.44%) Cloud Security
7 20 (18.52%) Low Latency
8 19 (17.59%) Deployment Automation
8 19 (17.59%) Site Reliability Engineering
9 18 (16.67%) Fintech
10 15 (13.89%) Continuous Delivery
10 15 (13.89%) High Availability
10 15 (13.89%) Microservices
11 13 (12.04%) Computer Science
11 13 (12.04%) Mentoring
11 13 (12.04%) Stakeholder Management
12 12 (11.11%) Cybersecurity
12 12 (11.11%) Infrastructure Engineering
13 11 (10.19%) Risk Management
Programming Languages
1 54 (50.00%) Python
2 18 (16.67%) Bicep
3 14 (12.96%) PowerShell
4 13 (12.04%) Java
5 12 (11.11%) Ruby
6 11 (10.19%) Go
7 7 (6.48%) SQL
8 4 (3.70%) C#
9 3 (2.78%) Bash
9 3 (2.78%) TypeScript
10 2 (1.85%) JavaScript
11 1 (0.93%) C
11 1 (0.93%) C++
11 1 (0.93%) Groovy
11 1 (0.93%) T-SQL
Qualifications
1 27 (25.00%) Degree
2 14 (12.96%) Cisco Certification
3 10 (9.26%) CCNA
4 8 (7.41%) Microsoft Certification
4 8 (7.41%) Network+ Certification
5 7 (6.48%) Security Cleared
6 6 (5.56%) SC Cleared
7 4 (3.70%) AWS Certification
7 4 (3.70%) CCNP
7 4 (3.70%) Master's Degree
8 3 (2.78%) CISSP
9 2 (1.85%) (ISC)2 CCSP
9 2 (1.85%) Azure Certification
9 2 (1.85%) Computer Science Degree
9 2 (1.85%) CRISC
9 2 (1.85%) PhD
10 1 (0.93%) AWS Certified DevOps Engineer
10 1 (0.93%) AWS Certified Solutions Architect
10 1 (0.93%) AWS Certified SysOps Administrator
10 1 (0.93%) CCSK
Quality Assurance & Compliance
1 6 (5.56%) ISO/IEC 27001
2 3 (2.78%) Cyber Essentials
2 3 (2.78%) QA
3 2 (1.85%) GDPR
3 2 (1.85%) NCSC
3 2 (1.85%) NIST
3 2 (1.85%) PCI DSS
4 1 (0.93%) Cyber Essentials PLUS
4 1 (0.93%) Sarbanes-Oxley
4 1 (0.93%) SLA
System Software
1 25 (23.15%) Docker
2 15 (13.89%) Active Directory
3 13 (12.04%) VMware Infrastructure
4 11 (10.19%) Hyper-V
5 10 (9.26%) Virtual Desktop
6 8 (7.41%) VMware ESXi
7 5 (4.63%) VMware NSX
8 1 (0.93%) BitLocker
8 1 (0.93%) KVM
8 1 (0.93%) Virtual Machines
8 1 (0.93%) Xen
Systems Management
1 50 (46.30%) Terraform
2 48 (44.44%) Kubernetes
3 41 (37.96%) Ansible
4 24 (22.22%) Puppet
5 23 (21.30%) Progress Chef
6 18 (16.67%) Podman
7 14 (12.96%) Microsoft Intune
8 12 (11.11%) SCCM
9 8 (7.41%) WSUS
10 6 (5.56%) Argo
10 6 (5.56%) FortiGate
11 5 (4.63%) Istio
12 4 (3.70%) Active Directory Federation Services
12 4 (3.70%) Consul
12 4 (3.70%) Prometheus
13 3 (2.78%) Grafana
14 2 (1.85%) Kustomize
14 2 (1.85%) Single Sign-On
14 2 (1.85%) VxRail
15 1 (0.93%) Avamar
Vendors
1 26 (24.07%) Microsoft
2 21 (19.44%) Cisco
3 20 (18.52%) VMware
4 12 (11.11%) Google
5 8 (7.41%) CheckPoint
5 8 (7.41%) Citrix
5 8 (7.41%) Veeam
6 6 (5.56%) F5
7 5 (4.63%) Blue Coat
7 5 (4.63%) Dell
8 3 (2.78%) New Relic
8 3 (2.78%) Okta
8 3 (2.78%) Red Hat
8 3 (2.78%) SolarWinds
9 2 (1.85%) BiZZdesign
9 2 (1.85%) Fortinet
9 2 (1.85%) Oracle
9 2 (1.85%) Palo Alto
9 2 (1.85%) SimCorp
9 2 (1.85%) Sparx