User Interface/User Experience Developer
England > London
As of 23 January 2026, there is not enough information available from job vacancies posted within the last 6 months to determine the median User Interface/User Experience Developer daily rate in London.
| 6 months to 23 Jan 2026 |
Same period 2025 | Same period 2024 | |
|---|---|---|---|
| Rank | - | 355 | 397 |
| Rank change year-on-year | - | +42 | +137 |
| Contract jobs requiring a UI/UX Developer | 0 | 6 | 3 |
| As % of all contract jobs in London | - | 0.043% | 0.016% |
| As % of the Job Titles category | - | 0.046% | 0.018% |
| Number of daily rates quoted | 0 | 3 | 3 |
| 10th Percentile | - | - | £403 |
| 25th Percentile | - | £525 | £406 |
| Median daily rate (50th Percentile) | - | £550 | £425 |
| Median % change year-on-year | - | +29.41% | -21.30% |
| 75th Percentile | - | £575 | £506 |
| 90th Percentile | - | - | £548 |
| England median daily rate | - | £550 | £413 |
| % change year-on-year | - | +33.33% | -17.50% |
All Contract IT Job Roles
London
For comparison with the information above, the following table provides summary statistics for all contract IT job vacancies in London. Most job vacancies include a discernible job title that can be normalized. As such, the figures in the second row provide an indication of the number of contract jobs in our overall sample.
| Contract vacancies in London with a recognized job title | 13,543 | 13,061 | 16,991 |
| % of contract IT jobs with a recognized job title | 92.60% | 93.59% | 93.10% |
| Number of daily rates quoted | 9,012 | 8,409 | 12,260 |
| 10th Percentile | £350 | £338 | £325 |
| 25th Percentile | £425 | £450 | £450 |
| Median daily rate (50th Percentile) | £525 | £550 | £550 |
| Median % change year-on-year | -4.55% | - | -6.38% |
| 75th Percentile | £650 | £675 | £675 |
| 90th Percentile | £750 | £800 | £788 |
| England median daily rate | £501 | £525 | £525 |
| % change year-on-year | -4.67% | - | -4.55% |
| Number of hourly rates quoted | 221 | 142 | 285 |
| 10th Percentile | £18.25 | £20.75 | £16.02 |
| 25th Percentile | £23.55 | £24.26 | £19.00 |
| Median hourly rate | £32.50 | £35.00 | £29.72 |
| Median % change year-on-year | -7.14% | +17.77% | -10.37% |
| 75th Percentile | £63.10 | £53.75 | £52.50 |
| 90th Percentile | £76.58 | £80.55 | £67.20 |
| England median hourly rate | £29.60 | £35.00 | £39.55 |
| % change year-on-year | -15.43% | -11.50% | +13.00% |
UI/UX Developer
Job Vacancy Trend in London
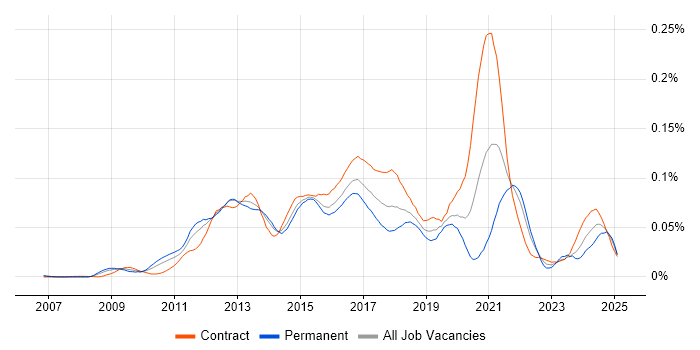
Historical trend showing the proportion of contract IT job postings featuring 'UI/UX Developer' in the job title relative to all contract IT jobs advertised in London.

UI/UX Developer
Daily Rate Trend in London
Contractor daily rate distribution trend for UI/UX Developer job vacancies in London.

UI/UX Developer
Hourly Rate Trend in London
Contractor hourly rate distribution trend for UI/UX Developer job vacancies in London.

