CI/CD Contracts in the Thames Valley

CI/CD
South East > Thames Valley

The table below provides summary statistics for contract job vacancies advertised in the Thames Valley requiring CI/CD skills. It includes a benchmarking guide to the contractor rates offered in vacancies that cited CI/CD over the 6 months leading up to 31 October 2024, comparing them to the same period in the previous two years.

6 months to
31 Oct 2024
Same period 2023 Same period 2022
Rank 26 44 53
Rank change year-on-year +18 +9 -16
Contract jobs citing CI/CD 162 119 160
As % of all contract jobs advertised in the Thames Valley 7.57% 4.48% 4.04%
As % of the Processes & Methodologies category 8.70% 4.94% 4.45%
Number of daily rates quoted 106 94 117
10th Percentile £406 £456 £450
25th Percentile £500 £530 £485
Median daily rate (50th Percentile) £600 £625 £550
Median % change year-on-year -4.00% +13.64% +5.77%
75th Percentile £643 £705 £635
90th Percentile £658 £743 £705
South East median daily rate £555 £600 £550
% change year-on-year -7.50% +9.09% +4.76%
Number of hourly rates quoted 0 1 2
10th Percentile - - £68.20
25th Percentile - £51.05 £69.46
Median hourly rate - £52.10 £71.56
Median % change year-on-year - -27.19% +7.20%
75th Percentile - £53.15 £73.65
90th Percentile - - £74.91
South East median hourly rate - £76.53 £67.50
% change year-on-year - +13.38% +3.05%

All Process and Methodology Skills
Thames Valley

CI/CD falls under the Processes and Methodologies category. For comparison with the information above, the following table provides summary statistics for all contract job vacancies requiring process or methodology skills in the Thames Valley.

Contract vacancies with a requirement for process or methodology skills 1,861 2,411 3,599
As % of all contract IT jobs advertised in the Thames Valley 87.00% 90.74% 90.77%
Number of daily rates quoted 1,069 1,584 2,502
10th Percentile £300 £245 £305
25th Percentile £411 £400 £400
Median daily rate (50th Percentile) £510 £500 £500
Median % change year-on-year +2.00% - +8.11%
75th Percentile £625 £623 £612
90th Percentile £675 £700 £675
South East median daily rate £511 £520 £513
% change year-on-year -1.70% +1.46% +7.89%
Number of hourly rates quoted 69 100 72
10th Percentile £18.00 £16.39 £11.42
25th Percentile £27.75 £24.00 £14.06
Median hourly rate £57.50 £50.00 £19.25
Median % change year-on-year +15.00% +159.74% -
75th Percentile £62.69 £66.11 £50.31
90th Percentile £70.72 £75.67 £75.75
South East median hourly rate £58.30 £52.30 £37.13
% change year-on-year +11.47% +40.86% +35.02%

CI/CD
Job Vacancy Trend in the Thames Valley

Job postings citing CI/CD as a proportion of all IT jobs advertised in the Thames Valley.
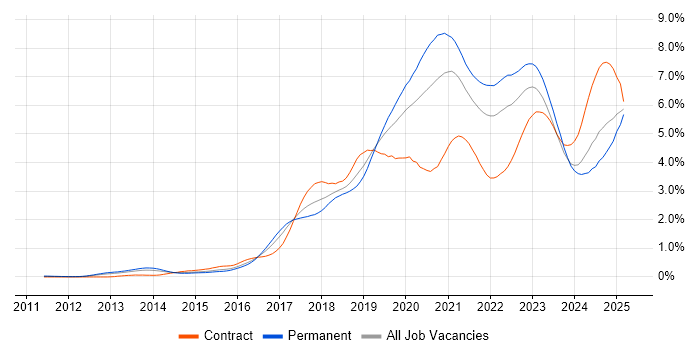
Job vacancy trend for CI/CD in the Thames Valley

CI/CD
Contractor Daily Rate Trend in the Thames Valley

3-month moving average daily rate quoted in jobs citing CI/CD in the Thames Valley.

Daily rate trend for CI/CD in the Thames Valley

CI/CD
Daily Rate Histogram in the Thames Valley

Daily rate distribution for jobs citing CI/CD in the Thames Valley over the 6 months to 31 October 2024.

Daily rate histogram for CI/CD in the Thames Valley

CI/CD
Contractor Hourly Rate Trend in the Thames Valley

3-month moving average hourly rates quoted in jobs citing CI/CD in the Thames Valley.

Hourly rate trend for CI/CD in the Thames Valley

CI/CD
Contract Job Locations in the Thames Valley

The table below looks at the demand and provides a guide to the median contractor rates quoted in IT jobs citing CI/CD within the Thames Valley region over the 6 months to 31 October 2024. The 'Rank Change' column provides an indication of the change in demand within each location based on the same 6 month period last year.

Location Rank Change
on Same Period
Last Year
Matching
Contract
IT Job Ads
Median
Daily Rate
Past 6 Months
Median Daily Rate
% Change
on Same Period
Last Year
Live
Jobs
Berkshire +10 130 £605 -3.20% 21
Buckinghamshire +23 27 £568 -12.69% 8
Oxfordshire +13 5 £475 +11.76% 9
CI/CD
South East

CI/CD
Co-occurring Skills and Capabilities in the Thames Valley by Category

The follow tables expand on the table above by listing co-occurrences grouped by category. The same employment type, locality and period is covered with up to 20 co-occurrences shown in each of the following categories:

Application Platforms
1 11 (6.79%) Microsoft Exchange
2 8 (4.94%) Confluence
3 5 (3.09%) Apache
4 2 (1.23%) Apache Spark
4 2 (1.23%) Appian
5 1 (0.62%) Anypoint
5 1 (0.62%) CMS
5 1 (0.62%) nginx
5 1 (0.62%) OpenStack
5 1 (0.62%) Tomcat
5 1 (0.62%) Umbraco
Cloud Services
1 98 (60.49%) Azure
2 46 (28.40%) Serverless
3 41 (25.31%) Azure Functions
3 41 (25.31%) Azure Monitor
4 37 (22.84%) AWS
5 35 (21.60%) Azure Data Factory
6 31 (19.14%) Azure Cosmos DB
7 29 (17.90%) Entra ID
8 26 (16.05%) Azure DevOps
9 19 (11.73%) Microsoft 365
10 15 (9.26%) Azure AKS
10 15 (9.26%) Azure Key Vault
10 15 (9.26%) GCP
11 12 (7.41%) Azure API Management
12 11 (6.79%) Azure Storage
13 9 (5.56%) PaaS
14 7 (4.32%) Azure Service Bus
15 6 (3.70%) Amazon S3
16 5 (3.09%) IaaS
16 5 (3.09%) SaaS
Communications & Networking
1 22 (13.58%) VPN
2 18 (11.11%) MPLS
3 16 (9.88%) BGP
3 16 (9.88%) Ethernet VPN
4 12 (7.41%) Firewall
5 11 (6.79%) DHCP
5 11 (6.79%) DNS
6 10 (6.17%) VSAN
7 5 (3.09%) 4G
7 5 (3.09%) 5G
7 5 (3.09%) LTE
8 4 (2.47%) FTP
8 4 (2.47%) Radio Access Network
8 4 (2.47%) SMTP
9 3 (1.85%) 5G NR
10 2 (1.23%) 3G
10 2 (1.23%) HTTP
10 2 (1.23%) SNMP
10 2 (1.23%) VoIP
10 2 (1.23%) Wireshark
Database & Business Intelligence
1 38 (23.46%) NoSQL
2 18 (11.11%) MongoDB
3 13 (8.02%) PostgreSQL
4 12 (7.41%) Redis
5 7 (4.32%) Data Lake
6 6 (3.70%) Data Warehouse
7 4 (2.47%) Delta Lake
7 4 (2.47%) MySQL
8 3 (1.85%) SQL Server
9 2 (1.23%) Big Data
9 2 (1.23%) BigQuery
9 2 (1.23%) Oracle Database
9 2 (1.23%) Relational Database
9 2 (1.23%) SSDT
10 1 (0.62%) Azure SQL Database
10 1 (0.62%) MariaDB
10 1 (0.62%) SQL Server Integration Services
Development Applications
1 42 (25.93%) Git
2 28 (17.28%) Selenium
3 27 (16.67%) GitLab
4 24 (14.81%) JIRA
5 21 (12.96%) Jenkins
6 8 (4.94%) Visual Studio
7 5 (3.09%) Bitbucket
8 4 (2.47%) Gradle
8 4 (2.47%) IntelliJ
8 4 (2.47%) Maven
8 4 (2.47%) TestLink
9 3 (1.85%) Cypress.io
10 2 (1.23%) Octopus Deploy
10 2 (1.23%) Robot Framework
11 1 (0.62%) CircleCI
11 1 (0.62%) Cucumber
11 1 (0.62%) Postman
11 1 (0.62%) Snyk
11 1 (0.62%) SonarQube
11 1 (0.62%) Team Foundation Server
General
1 39 (24.07%) Social Skills
2 31 (19.14%) Analytical Skills
3 15 (9.26%) Telecoms
4 7 (4.32%) Public Sector
5 3 (1.85%) Retail
6 1 (0.62%) Back Office
6 1 (0.62%) Documentation Skills
6 1 (0.62%) Electronics
6 1 (0.62%) Finance
6 1 (0.62%) Manufacturing
6 1 (0.62%) Marketing
6 1 (0.62%) Organisational Skills
Job Titles
1 53 (32.72%) Developer
2 28 (17.28%) Azure Engineer
3 27 (16.67%) Full-Stack Developer
3 27 (16.67%) Senior
4 26 (16.05%) DevOps Engineer
5 23 (14.20%) Azure Developer
6 22 (13.58%) Architect
7 14 (8.64%) Lead
8 13 (8.02%) Azure DevOps Engineer
8 13 (8.02%) Full-Stack Python Developer
8 13 (8.02%) Python Developer
8 13 (8.02%) Senior Developer
9 11 (6.79%) Active Directory Engineer
9 11 (6.79%) Active Directory Support
9 11 (6.79%) Active Directory Support Engineer
9 11 (6.79%) Support Engineer
10 9 (5.56%) Backend Developer
10 9 (5.56%) Technical Architect
11 8 (4.94%) React Developer
11 8 (4.94%) Tester
Libraries, Frameworks & Software Standards
1 24 (14.81%) React
1 24 (14.81%) REST
2 20 (12.35%) Node.js
3 19 (11.73%) YANG
4 18 (11.11%) NETCONF
5 17 (10.49%) RESTful
5 17 (10.49%) SOAP
6 16 (9.88%) RESTCONF
7 14 (8.64%) AngularJS
8 13 (8.02%) ARM Templates
9 12 (7.41%) ADO
9 12 (7.41%) Kafka
10 10 (6.17%) GraphQL
10 10 (6.17%) HTML
10 10 (6.17%) YAML
11 9 (5.56%) CSS
11 9 (5.56%) Prisma
12 7 (4.32%) Gherkin
12 7 (4.32%) JSON
12 7 (4.32%) XML
Miscellaneous
1 25 (15.43%) Product Ownership
2 23 (14.20%) PKI
3 12 (7.41%) Hybrid Cloud
4 11 (6.79%) Self-Motivation
4 11 (6.79%) Wiki
5 9 (5.56%) Public Cloud
6 5 (3.09%) Data Protection Act
6 5 (3.09%) Virtual Team
7 4 (2.47%) Security Posture
8 3 (1.85%) Algorithms
8 3 (1.85%) Cloud Native
8 3 (1.85%) Onboarding
8 3 (1.85%) TM Forum
9 2 (1.23%) Distributed Systems
9 2 (1.23%) Renewable Energy
9 2 (1.23%) Team-Oriented Environment
10 1 (0.62%) Cloud Security Posture
10 1 (0.62%) IoT
10 1 (0.62%) Private Cloud
10 1 (0.62%) Smart Meter
Operating Systems
1 40 (24.69%) Linux
2 17 (10.49%) Unix
3 16 (9.88%) CentOS
4 13 (8.02%) Windows
5 11 (6.79%) Windows Server
5 11 (6.79%) Windows Server 2016
5 11 (6.79%) Windows Server 2019
6 1 (0.62%) Red Hat Enterprise Linux
6 1 (0.62%) SUSE
Processes & Methodologies
1 96 (59.26%) DevOps
2 77 (47.53%) Agile
3 55 (33.95%) Microservices
4 49 (30.25%) Containerisation
5 44 (27.16%) Infrastructure as Code
5 44 (27.16%) Test Automation
6 40 (24.69%) Full-Stack Development
7 35 (21.60%) ITIL
8 34 (20.99%) Scrum
9 31 (19.14%) SDLC
10 30 (18.52%) Problem-Solving
11 28 (17.28%) Continuous Improvement
12 22 (13.58%) ETL
13 21 (12.96%) Workflow
14 20 (12.35%) Continuous Integration
15 17 (10.49%) Analytics
15 17 (10.49%) Migration
16 16 (9.88%) API Design
17 14 (8.64%) Software Testing
17 14 (8.64%) Unit Testing
Programming Languages
1 73 (45.06%) Python
2 39 (24.07%) SQL
3 36 (22.22%) Java
4 18 (11.11%) PowerShell
5 17 (10.49%) C#
6 14 (8.64%) JavaScript
7 13 (8.02%) Bicep
8 11 (6.79%) VB
8 11 (6.79%) VBScript
9 9 (5.56%) PHP
9 9 (5.56%) TypeScript
10 7 (4.32%) Go
10 7 (4.32%) Groovy
10 7 (4.32%) R
11 6 (3.70%) C
11 6 (3.70%) C++
12 5 (3.09%) Bash
13 4 (2.47%) T-SQL
14 2 (1.23%) Scala
Qualifications
1 32 (19.75%) Security Cleared
2 26 (16.05%) SC Cleared
3 19 (11.73%) DV Cleared
4 16 (9.88%) Degree
5 11 (6.79%) ITIL Foundation Certificate
6 10 (6.17%) MCSE
6 10 (6.17%) Microsoft Certification
6 10 (6.17%) VMware Certified Professional (VCP)
7 5 (3.09%) AAT
8 2 (1.23%) AWS Certification
8 2 (1.23%) Azure Certification
8 2 (1.23%) BPSS Clearance
9 1 (0.62%) AWS Certified Solutions Architect
Quality Assurance & Compliance
1 15 (9.26%) NIST
1 15 (9.26%) QA
2 11 (6.79%) Cyber Essentials
2 11 (6.79%) NCSC
3 4 (2.47%) ISO/IEC 27001
4 3 (1.85%) GDPR
5 2 (1.23%) Data Quality
6 1 (0.62%) Accessibility
System Software
1 35 (21.60%) Docker
2 31 (19.14%) Active Directory
3 14 (8.64%) VMware Infrastructure
4 11 (6.79%) Virtual Desktop
4 11 (6.79%) Virtual Machines
5 10 (6.17%) VMware NSX
Systems Management
1 55 (33.95%) Kubernetes
2 24 (14.81%) Terraform
3 18 (11.11%) Ansible
4 11 (6.79%) Active Directory Federation Services
4 11 (6.79%) Microsoft Intune
4 11 (6.79%) SCCM
4 11 (6.79%) SCOM
4 11 (6.79%) WSUS
5 4 (2.47%) Grafana
5 4 (2.47%) Prometheus
5 4 (2.47%) Rancher
6 2 (1.23%) Argo
6 2 (1.23%) Kustomize
7 1 (0.62%) CloudHub
7 1 (0.62%) NSN NetAct
Vendors
1 30 (18.52%) Microsoft
2 25 (15.43%) Cisco
3 14 (8.64%) VMware
4 12 (7.41%) Palo Alto
5 11 (6.79%) Oracle
6 8 (4.94%) Ericsson
6 8 (4.94%) Google
7 6 (3.70%) Nokia
8 5 (3.09%) Databricks
8 5 (3.09%) SAP
9 3 (1.85%) Salesforce
10 2 (1.23%) Blue Prism
10 2 (1.23%) Rakuten
10 2 (1.23%) SendGrid
10 2 (1.23%) ServiceNow
11 1 (0.62%) F5
11 1 (0.62%) MuleSoft
11 1 (0.62%) Red Hat
11 1 (0.62%) Virgin Media