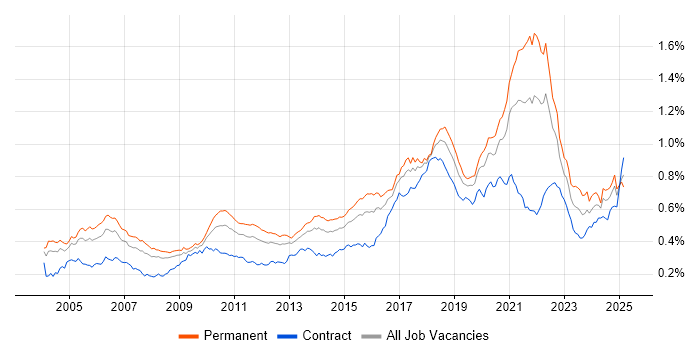
Distributed Systems Jobs in England

Distributed Systems
UK > England

The table below looks at the prevalence of the term Distributed Systems in permanent job vacancies in England. Included is a benchmarking guide to the salaries offered in vacancies that cited Distributed Systems over the 6 months leading up to 31 October 2024, comparing them to the same period in the previous two years.

6 months to
31 Oct 2024
Same period 2023 Same period 2022
Rank 359 398 261
Rank change year-on-year +39 -137 -35
Permanent jobs citing Distributed Systems 471 350 1,748
As % of all permanent jobs advertised in England 0.71% 0.69% 1.47%
As % of the Miscellaneous category 2.17% 1.82% 3.26%
Number of salaries quoted 298 256 569
10th Percentile £48,250 £50,625 £53,750
25th Percentile £61,313 £62,500 £65,000
Median annual salary (50th Percentile) £82,000 £80,000 £85,000
Median % change year-on-year +2.50% -5.88% +13.33%
75th Percentile £115,000 £120,000 £106,250
90th Percentile £140,000 £147,500 £127,500
UK median annual salary £80,000 £80,000 £85,000
% change year-on-year - -5.88% +13.33%

All Generic Skills
England

Distributed Systems falls under the General and Transferable Skills category. For comparison with the information above, the following table provides summary statistics for all permanent job vacancies requiring generic IT skills in England.

Permanent vacancies with a requirement for generic IT skills 21,753 19,225 53,633
As % of all permanent jobs advertised in England 32.67% 38.03% 45.07%
Number of salaries quoted 9,848 14,129 28,430
10th Percentile £33,750 £34,000 £35,000
25th Percentile £46,250 £46,250 £46,250
Median annual salary (50th Percentile) £60,000 £62,500 £64,968
Median % change year-on-year -4.00% -3.80% +8.28%
75th Percentile £85,000 £85,000 £85,000
90th Percentile £112,500 £110,000 £107,500
UK median annual salary £60,000 £62,500 £62,500
% change year-on-year -4.00% - +4.17%

Distributed Systems
Job Vacancy Trend in England

Job postings citing Distributed Systems as a proportion of all IT jobs advertised in England.

Job vacancy trend for Distributed Systems in England

Distributed Systems
Salary Trend in England

3-month moving average salary quoted in jobs citing Distributed Systems in England.

Salary trend for Distributed Systems in England

Distributed Systems
Salary Histogram in England

Salary distribution for jobs citing Distributed Systems in England over the 6 months to 31 October 2024.

Salary histogram for Distributed Systems in England

Distributed Systems
Job Locations in England

The table below looks at the demand and provides a guide to the median salaries quoted in IT jobs citing Distributed Systems within the England region over the 6 months to 31 October 2024. The 'Rank Change' column provides an indication of the change in demand within each location based on the same 6 month period last year.

Location Rank Change
on Same Period
Last Year
Matching
Permanent
IT Job Ads
Median Salary
Past 6 Months
Median Salary
% Change
on Same Period
Last Year
Live
Jobs
London +38 260 £97,500 -2.01% 64
North of England +74 142 £62,500 -3.85% 18
North West +20 71 £62,500 -3.85% 9
Yorkshire +67 68 £52,750 -21.88% 4
South East -23 46 £44,982 -35.74% 7
Midlands -35 18 £69,308 +26.01% 8
West Midlands -26 16 £69,308 +26.01% 8
East of England -58 15 £72,500 -9.38% 2
South West -5 14 £95,000 +35.71% 2
North East -38 3 £69,308 +6.63% 6
East Midlands -43 2 £102,500 -
Distributed Systems
UK

Distributed Systems
Co-occurring Skills and Capabilities in England by Category

The follow tables expand on the table above by listing co-occurrences grouped by category. The same employment type, locality and period is covered with up to 20 co-occurrences shown in each of the following categories:

Application Platforms
1 26 (5.52%) Apache Spark
2 14 (2.97%) Confluence
3 12 (2.55%) Apache Solr
3 12 (2.55%) nginx
4 9 (1.91%) OpenStack
5 6 (1.27%) Solana
6 5 (1.06%) JBoss
7 4 (0.85%) Red Hat Fuse
8 3 (0.64%) Oracle Workflow
9 2 (0.42%) Apache
10 1 (0.21%) Apache Airflow
10 1 (0.21%) CMS
10 1 (0.21%) DataSynapse
10 1 (0.21%) IIS
10 1 (0.21%) Magnolia
10 1 (0.21%) Microsoft Exchange
10 1 (0.21%) SharePoint
Applications
1 6 (1.27%) Spreadsheet
Business Applications
1 1 (0.21%) Endur
1 1 (0.21%) Ripple
1 1 (0.21%) Ripple XRP
1 1 (0.21%) Salesforce CRM
1 1 (0.21%) SAP S/4HANA
Cloud Services
1 223 (47.35%) AWS
2 155 (32.91%) Azure
3 119 (25.27%) GCP
4 75 (15.92%) GitHub
5 67 (14.23%) GitHub Actions
6 64 (13.59%) Serverless
7 41 (8.70%) Amazon Kinesis
8 34 (7.22%) AWS Lambda
9 33 (7.01%) Azure Functions
10 28 (5.94%) Amazon ECS
11 25 (5.31%) PaaS
12 24 (5.10%) Amazon EKS
12 24 (5.10%) Cloud Computing
13 22 (4.67%) AWS CloudFormation
14 19 (4.03%) Azure DevOps
15 16 (3.40%) Amazon EC2
16 13 (2.76%) Amazon OpenSearch
16 13 (2.76%) Amazon S3
17 12 (2.55%) Amazon ECR
17 12 (2.55%) dbt
Communications & Networking
1 24 (5.10%) HTTP
2 18 (3.82%) TCP/IP
3 14 (2.97%) Internet
4 7 (1.49%) Kerberos
5 6 (1.27%) SNMP
6 5 (1.06%) Modbus
7 4 (0.85%) VPN
8 3 (0.64%) BGP
8 3 (0.64%) DNS
8 3 (0.64%) VLAN
9 2 (0.42%) 5G
9 2 (0.42%) DSL
10 1 (0.21%) DHCP
10 1 (0.21%) Firewall
10 1 (0.21%) ICMP
10 1 (0.21%) RTP
10 1 (0.21%) SD-WAN
10 1 (0.21%) SMTP
10 1 (0.21%) VoIP
10 1 (0.21%) WAN
Database & Business Intelligence
1 103 (21.87%) PostgreSQL
2 81 (17.20%) NoSQL
3 54 (11.46%) DynamoDB
4 52 (11.04%) Amazon Aurora
5 36 (7.64%) Redis
6 30 (6.37%) Relational Database
7 23 (4.88%) Big Data
8 20 (4.25%) Amazon RDS
8 20 (4.25%) Elasticsearch
9 19 (4.03%) MySQL
10 15 (3.18%) BigQuery
10 15 (3.18%) RDBMS
11 13 (2.76%) MongoDB
12 9 (1.91%) SQL Server
13 6 (1.27%) Apache Cassandra
14 5 (1.06%) Azure SQL Database
15 2 (0.42%) Amazon Redshift
15 2 (0.42%) Data Lake
15 2 (0.42%) Geospatial Data
16 1 (0.21%) Metadata
Development Applications
1 71 (15.07%) Git
2 65 (13.80%) Jenkins
3 59 (12.53%) CircleCI
4 42 (8.92%) Mockito
5 38 (8.07%) Gradle
6 35 (7.43%) Maven
7 25 (5.31%) Sonatype Nexus
8 23 (4.88%) Gatling
9 22 (4.67%) JIRA
9 22 (4.67%) JUnit
10 18 (3.82%) GitLab
11 9 (1.91%) DbUnit
12 8 (1.70%) Cucumber
12 8 (1.70%) JMeter
12 8 (1.70%) SonarQube
13 6 (1.27%) Artifactory
14 4 (0.85%) GDB
15 3 (0.64%) Bitbucket
16 2 (0.42%) jMock
16 2 (0.42%) Visual Studio
General
1 146 (31.00%) Social Skills
2 100 (21.23%) Finance
3 77 (16.35%) Public Sector
4 49 (10.40%) Organisational Skills
5 45 (9.55%) Inclusion and Diversity
6 33 (7.01%) Law
7 29 (6.16%) Legal
8 26 (5.52%) Retail
9 24 (5.10%) Front Office
10 21 (4.46%) Games
11 20 (4.25%) Advertising
12 19 (4.03%) Banking
13 18 (3.82%) Financial Institution
14 15 (3.18%) Electronics
15 14 (2.97%) Marketing
16 13 (2.76%) Billing
17 6 (1.27%) Analytical Skills
17 6 (1.27%) Telecoms
18 5 (1.06%) Investment Banking
19 4 (0.85%) Back Office
Job Titles
1 178 (37.79%) Software Engineer
2 173 (36.73%) Senior
3 143 (30.36%) Developer
4 104 (22.08%) Lead
5 82 (17.41%) Senior Software Engineer
6 72 (15.29%) Lead Software Engineer
7 71 (15.07%) Java Developer
8 53 (11.25%) Cloud Engineer
9 38 (8.07%) Senior Developer
10 37 (7.86%) DevOps Engineer
11 33 (7.01%) Cloud Native Engineer
11 33 (7.01%) Cloud Software Engineer
12 31 (6.58%) Software Developer
13 28 (5.94%) C# Developer
13 28 (5.94%) C# Software Engineer
14 23 (4.88%) Senior Java Developer
15 22 (4.67%) Platform Engineer
16 21 (4.46%) Full-Stack Developer
17 20 (4.25%) .NET Software Engineer
18 18 (3.82%) Senior Cloud Engineer
Libraries, Frameworks & Software Standards
1 89 (18.90%) RESTful
2 79 (16.77%) REST
3 71 (15.07%) Kafka
3 71 (15.07%) Web Services
4 63 (13.38%) .NET
4 63 (13.38%) Spring
5 60 (12.74%) Spring Boot
6 53 (11.25%) AngularJS
6 53 (11.25%) OAuth
7 49 (10.40%) SAML
8 47 (9.98%) OAuth2
9 43 (9.13%) RabbitMQ
9 43 (9.13%) React
10 40 (8.49%) GraphQL
10 40 (8.49%) http4s
10 40 (8.49%) Scalaz
11 38 (8.07%) .NET Core
12 21 (4.46%) HTML
13 20 (4.25%) jQuery
14 16 (3.40%) WebSockets
Miscellaneous
1 81 (17.20%) Cloud Native
2 63 (13.38%) Public Cloud
3 53 (11.25%) Media Streaming
4 46 (9.77%) Blog
5 37 (7.86%) Legacy Code
6 32 (6.79%) Self-Motivation
7 31 (6.58%) Algorithms
8 21 (4.46%) Blockchain
9 18 (3.82%) Distributed Computing
9 18 (3.82%) Product Ownership
10 14 (2.97%) Equities
11 13 (2.76%) Foreign Exchange (FX)
12 12 (2.55%) Data Centre
13 11 (2.34%) Data Structures
14 9 (1.91%) Distributed Architecture
14 9 (1.91%) Greenfield Project
15 8 (1.70%) Enterprise Software
16 6 (1.27%) Embedded Systems
16 6 (1.27%) Hybrid Cloud
16 6 (1.27%) Web3
Operating Systems
1 124 (26.33%) Linux
2 14 (2.97%) Windows
3 12 (2.55%) Unix
4 9 (1.91%) Red Hat Enterprise Linux
5 5 (1.06%) CentOS
6 3 (0.64%) Embedded Linux
7 2 (0.42%) Ubuntu
7 2 (0.42%) Windows 10
8 1 (0.21%) Android
8 1 (0.21%) Apple iOS
8 1 (0.21%) Windows Server
8 1 (0.21%) Windows Server 2012
8 1 (0.21%) Windows Server 2016
8 1 (0.21%) Windows Server 2019
Processes & Methodologies
1 238 (50.53%) Software Engineering
2 187 (39.70%) Agile
3 184 (39.07%) CI/CD
4 177 (37.58%) DevOps
5 150 (31.85%) Microservices
6 121 (25.69%) Containerisation
7 103 (21.87%) Continuous Integration
8 100 (21.23%) Infrastructure as Code
9 99 (21.02%) Open Source
10 98 (20.81%) Computer Science
11 89 (18.90%) Stakeholder Management
12 84 (17.83%) Mentoring
13 82 (17.41%) Unit Testing
14 74 (15.71%) Deployment Automation
15 68 (14.44%) TDD
16 63 (13.38%) Design Patterns
16 63 (13.38%) Event-Driven
17 61 (12.95%) Full-Stack Development
18 59 (12.53%) Machine Learning
19 54 (11.46%) SDLC
Programming Languages
1 162 (34.39%) Java
2 138 (29.30%) Python
3 116 (24.63%) Go
4 93 (19.75%) Scala
5 90 (19.11%) Rust
6 80 (16.99%) C++
7 79 (16.77%) C#
8 72 (15.29%) SQL
9 67 (14.23%) JavaScript
10 53 (11.25%) TypeScript
11 42 (8.92%) C
12 22 (4.67%) PowerShell
13 20 (4.25%) Kotlin
14 19 (4.03%) Shell Script
15 14 (2.97%) Haskell
16 11 (2.34%) Perl
17 10 (2.12%) Bash
18 8 (1.70%) PHP
19 6 (1.27%) Clojure
19 6 (1.27%) Groovy
Qualifications
1 89 (18.90%) Degree
2 43 (9.13%) Computer Science Degree
3 36 (7.64%) Security Cleared
4 33 (7.01%) SC Cleared
5 24 (5.10%) Master's Degree
6 8 (1.70%) DV Cleared
7 6 (1.27%) Azure Certification
8 5 (1.06%) AWS Certification
8 5 (1.06%) CTC Cleared
9 4 (0.85%) PhD
10 2 (0.42%) AWS Certified Solutions Architect
11 1 (0.21%) BPSS Clearance
11 1 (0.21%) Microsoft Certification
Quality Assurance & Compliance
1 33 (7.01%) QA
2 14 (2.97%) PCI DSS
3 9 (1.91%) Accessibility
4 8 (1.70%) Cyber Essentials
4 8 (1.70%) ISO/IEC 27001
5 7 (1.49%) NIST
5 7 (1.49%) SOC 2
6 6 (1.27%) GDPR
6 6 (1.27%) HIPAA
7 1 (0.21%) California Consumer Privacy Act
7 1 (0.21%) Data Quality
System Software
1 179 (38.00%) Docker
2 21 (4.46%) Virtual Machines
3 5 (1.06%) Active Directory
4 4 (0.85%) Ceph
5 3 (0.64%) Firmware
6 2 (0.42%) Virtual Servers
7 1 (0.21%) BitLocker
7 1 (0.21%) Slurm Workload Manager
7 1 (0.21%) Terminal Services
Systems Management
1 237 (50.32%) Kubernetes
2 125 (26.54%) Terraform
3 21 (4.46%) Ansible
4 13 (2.76%) Grafana
5 10 (2.12%) Kibana
6 9 (1.91%) Packer
7 7 (1.49%) Prometheus
8 6 (1.27%) Single Sign-On
9 5 (1.06%) Cacti
9 5 (1.06%) Nagios
10 4 (0.85%) Knative
11 3 (0.64%) NetIQ Identity Manager
12 1 (0.21%) Active Directory Federation Services
12 1 (0.21%) Argo
12 1 (0.21%) Progress Chef
12 1 (0.21%) Puppet
Vendors
1 70 (14.86%) Google
2 44 (9.34%) Microsoft
3 20 (4.25%) Apple
4 14 (2.97%) Atlassian
5 12 (2.55%) OpenAI
6 8 (1.70%) Splunk
7 7 (1.49%) Dynatrace
8 6 (1.27%) AppDynamics
8 6 (1.27%) Databricks
8 6 (1.27%) IBM
9 5 (1.06%) Oracle
9 5 (1.06%) WSO2
10 3 (0.64%) ForgeRock
10 3 (0.64%) NetIQ
11 2 (0.42%) Sage
12 1 (0.21%) Informatica
12 1 (0.21%) OpenLink
12 1 (0.21%) Red Hat
12 1 (0.21%) Salesforce
12 1 (0.21%) SAP