Telecoms Jobs in London

Telecommunications
England > London

The table below looks at the prevalence of the term Telecoms in permanent job vacancies in London. Included is a benchmarking guide to the salaries offered in vacancies that cited Telecoms over the 6 months leading up to 25 April 2025, comparing them to the same period in the previous two years.

6 months to
25 Apr 2025
Same period 2024 Same period 2023
Rank 178 220 206
Rank change year-on-year +42 -14 +16
Permanent jobs citing Telecoms 257 329 642
As % of all permanent jobs advertised in London 1.96% 1.40% 1.78%
As % of the General category 2.56% 2.07% 2.57%
Number of salaries quoted 124 253 382
10th Percentile £39,125 £32,000 £40,125
25th Percentile £47,500 £45,000 £55,000
Median annual salary (50th Percentile) £70,000 £65,000 £70,000
Median % change year-on-year +7.69% -7.14% +12.00%
75th Percentile £85,938 £80,000 £90,000
90th Percentile £108,500 £92,500 £110,000
England median annual salary £45,000 £45,000 £55,000
% change year-on-year - -18.18% -

All General Skills
London

Telecoms falls under the General Skills category. For comparison with the information above, the following table provides summary statistics for all permanent job vacancies requiring common skills in London.

Permanent vacancies with a requirement for common skills 10,055 15,864 24,984
As % of all permanent jobs advertised in London 76.62% 67.42% 69.09%
Number of salaries quoted 5,675 11,356 17,122
10th Percentile £42,000 £36,250 £42,500
25th Percentile £56,250 £51,000 £55,000
Median annual salary (50th Percentile) £75,000 £70,000 £74,000
Median % change year-on-year +7.14% -5.41% +5.71%
75th Percentile £102,500 £93,750 £95,000
90th Percentile £125,000 £117,500 £120,000
England median annual salary £57,500 £52,500 £60,253
% change year-on-year +9.52% -12.87% +0.42%

Telecoms
Job Vacancy Trend in London

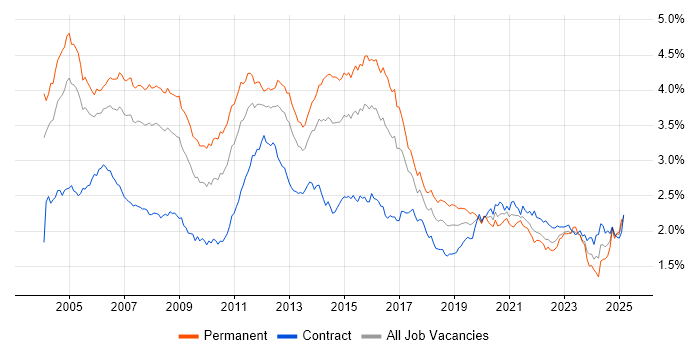
Job postings citing Telecoms as a proportion of all IT jobs advertised in London.

Job vacancy trend for Telecoms in London

Telecoms
Salary Trend in London

3-month moving average salary quoted in jobs citing Telecoms in London.

Salary trend for Telecoms in London

Telecoms
Salary Histogram in London

Salary distribution for jobs citing Telecoms in London over the 6 months to 25 April 2025.

Salary histogram for Telecoms in London

Telecoms
Job Locations in London

The table below looks at the demand and provides a guide to the median salaries quoted in IT jobs citing Telecoms within the London region over the 6 months to 25 April 2025. The 'Rank Change' column provides an indication of the change in demand within each location based on the same 6 month period last year.

Location Rank Change
on Same Period
Last Year
Matching
Permanent
IT Job Ads
Median Salary
Past 6 Months
Median Salary
% Change
on Same Period
Last Year
Live
Jobs
Central London +21 55 £50,000 - 18
West London +39 6 £70,000 +40.00% 16
East London -4 1 £31,000 -32.61% 9
Telecoms
England

Telecoms
Co-occurring Skills and Capabilities in London by Category

The follow tables expand on the table above by listing co-occurrences grouped by category. The same employment type, locality and period is covered with up to 20 co-occurrences shown in each of the following categories:

Application Platforms
1 8 (3.11%) Microsoft Exchange
2 5 (1.95%) SAS
3 2 (0.78%) SharePoint
4 1 (0.39%) OpenStack
Applications
1 28 (10.89%) Microsoft Office
2 19 (7.39%) Microsoft PowerPoint
3 18 (7.00%) Microsoft Excel
4 11 (4.28%) MS Visio
5 7 (2.72%) Maya
6 5 (1.95%) SPSS
7 3 (1.17%) Microsoft Project
8 1 (0.39%) Trello
Business Applications
1 12 (4.67%) Dynamics AX
2 7 (2.72%) SAP IBP
2 7 (2.72%) SAP S/4HANA
Cloud Services
1 41 (15.95%) Azure
2 32 (12.45%) AWS
3 30 (11.67%) GCP
4 16 (6.23%) SaaS
5 14 (5.45%) PaaS
6 9 (3.50%) Microsoft 365
7 5 (1.95%) IaaS
8 4 (1.56%) Cloud Computing
8 4 (1.56%) Entra ID
9 3 (1.17%) Power Platform
9 3 (1.17%) Serverless
10 2 (0.78%) Anthropic Claude
10 2 (0.78%) Asana
10 2 (0.78%) Azure Monitor
10 2 (0.78%) ChatGPT
10 2 (0.78%) Google Workspace
10 2 (0.78%) Microsoft Copilot
10 2 (0.78%) Slack
11 1 (0.39%) Azure DevOps
11 1 (0.39%) Nutanix
Communications & Networking
1 27 (10.51%) Network Security
2 23 (8.95%) Firewall
3 20 (7.78%) LAN
4 17 (6.61%) TCP/IP
5 10 (3.89%) Internet
5 10 (3.89%) VoIP
6 9 (3.50%) BGP
6 9 (3.50%) Link 16
6 9 (3.50%) Tactical Data Link
6 9 (3.50%) WAN
7 8 (3.11%) DNS
7 8 (3.11%) OSPF
7 8 (3.11%) Unified Communications
7 8 (3.11%) VLAN
8 7 (2.72%) RS-232
8 7 (2.72%) RS-485
8 7 (2.72%) VPN
8 7 (2.72%) Wi-Fi
9 6 (2.33%) HTTP
9 6 (2.33%) SMTP
Database & Business Intelligence
1 8 (3.11%) NoSQL
1 8 (3.11%) RDBMS
1 8 (3.11%) Relational Database
2 7 (2.72%) Data Warehouse
2 7 (2.72%) PostgreSQL
2 7 (2.72%) SAP BW
3 6 (2.33%) Big Data
4 5 (1.95%) Apache Hive
4 5 (1.95%) Hadoop
4 5 (1.95%) MySQL
5 4 (1.56%) Metadata
6 3 (1.17%) GIS
6 3 (1.17%) Power BI
7 2 (0.78%) Tableau
8 1 (0.39%) Apache Cassandra
8 1 (0.39%) CouchDB
8 1 (0.39%) Elasticsearch
8 1 (0.39%) MongoDB
8 1 (0.39%) SQL Server
Development Applications
1 11 (4.28%) Git
2 9 (3.50%) Jenkins
3 5 (1.95%) JIRA
4 3 (1.17%) Sonatype Nexus
5 1 (0.39%) Cucumber
5 1 (0.39%) GitLab
5 1 (0.39%) Gradle
5 1 (0.39%) Maven
5 1 (0.39%) MLflow
5 1 (0.39%) Octopus Deploy
5 1 (0.39%) Robot Framework
5 1 (0.39%) TeamCity
General
1 96 (37.35%) Finance
2 94 (36.58%) Social Skills
3 53 (20.62%) Manufacturing
4 50 (19.46%) Law
4 50 (19.46%) Marketing
5 42 (16.34%) Banking
6 41 (15.95%) Analytical Skills
7 37 (14.40%) Public Sector
8 32 (12.45%) Electronics
8 32 (12.45%) Retail
9 29 (11.28%) Inclusion and Diversity
10 26 (10.12%) Games
11 20 (7.78%) Legal
12 14 (5.45%) Advertising
12 14 (5.45%) Presentation Skills
13 13 (5.06%) Pharmaceutical
14 11 (4.28%) Billing
14 11 (4.28%) Documentation Skills
15 10 (3.89%) Military
16 9 (3.50%) Automotive
Job Titles
1 87 (33.85%) Senior
2 34 (13.23%) Analyst
3 25 (9.73%) Architect
3 25 (9.73%) IT Support
4 21 (8.17%) Network Engineer
5 17 (6.61%) Support Specialist
6 16 (6.23%) IT Analyst
6 16 (6.23%) IT Support Analyst
6 16 (6.23%) IT Support Specialist
6 16 (6.23%) Support Analyst
7 15 (5.84%) Developer
8 14 (5.45%) Consultant
9 13 (5.06%) Automation Engineer
9 13 (5.06%) Cloud Engineer
10 12 (4.67%) Field Engineer
10 12 (4.67%) Senior Developer
11 11 (4.28%) IT Manager
11 11 (4.28%) Risk Manager
11 11 (4.28%) Security Engineer
11 11 (4.28%) Senior Analyst
Libraries, Frameworks & Software Standards
1 10 (3.89%) REST
2 8 (3.11%) Node.js
3 7 (2.72%) FastAPI
3 7 (2.72%) Flask
3 7 (2.72%) Middleware
4 5 (1.95%) RESTful
5 4 (1.56%) 802.1X
5 4 (1.56%) Kafka
5 4 (1.56%) Spring Boot
6 3 (1.17%) RabbitMQ
6 3 (1.17%) XML
7 2 (0.78%) JSON
7 2 (0.78%) pytest
8 1 (0.39%) AngularJS
8 1 (0.39%) GraphQL
8 1 (0.39%) PyTorch
8 1 (0.39%) TensorFlow
Miscellaneous
1 28 (10.89%) Management Information System
2 23 (8.95%) Blockchain
2 23 (8.95%) Robotics
3 20 (7.78%) Data Centre
4 18 (7.00%) Video Conferencing
5 12 (4.67%) Enterprise Software
6 9 (3.50%) IoT
6 9 (3.50%) Public Cloud
7 8 (3.11%) Distributed Systems
8 7 (2.72%) PACS
8 7 (2.72%) PMI
8 7 (2.72%) Reinsurance
9 5 (1.95%) Distributed Computing
9 5 (1.95%) Mobile App
10 4 (1.56%) Driving Licence
10 4 (1.56%) Self-Motivation
11 3 (1.17%) Cyber Threat
11 3 (1.17%) Cybercrime
11 3 (1.17%) Product Ownership
12 2 (0.78%) Onboarding
Operating Systems
1 37 (14.40%) Windows
2 23 (8.95%) Linux
3 6 (2.33%) Android
3 6 (2.33%) Windows Server
4 5 (1.95%) Windows 10
5 3 (1.17%) Apple iOS
5 3 (1.17%) Mac OS
5 3 (1.17%) Red Hat Enterprise Linux
6 2 (0.78%) Android TV
6 2 (0.78%) Unix
6 2 (0.78%) Windows Server 2019
7 1 (0.39%) Windows 7
7 1 (0.39%) Windows Server 2008
7 1 (0.39%) Windows Server 2016
Processes & Methodologies
1 55 (21.40%) Problem-Solving
2 50 (19.46%) Agile
2 50 (19.46%) Analytics
3 45 (17.51%) Artificial Intelligence
4 41 (15.95%) Cybersecurity
5 40 (15.56%) Business Intelligence
6 36 (14.01%) Information Security
7 34 (13.23%) Change Management
8 33 (12.84%) Programme Management
9 32 (12.45%) Digital Marketing
10 31 (12.06%) ITIL
10 31 (12.06%) Project Delivery
11 27 (10.51%) Data Analytics
11 27 (10.51%) Mentoring
11 27 (10.51%) Roadmaps
12 26 (10.12%) Coaching
13 25 (9.73%) CI/CD
13 25 (9.73%) Computer Science
13 25 (9.73%) Creative Thinking
13 25 (9.73%) DevOps
Programming Languages
1 47 (18.29%) Python
2 18 (7.00%) R
3 12 (4.67%) SQL
4 9 (3.50%) C
5 7 (2.72%) Bash
6 5 (1.95%) Java
6 5 (1.95%) MATLAB
7 4 (1.56%) PowerShell
8 3 (1.17%) C++
9 2 (0.78%) TypeScript
10 1 (0.39%) C#
10 1 (0.39%) Go
10 1 (0.39%) JavaScript
10 1 (0.39%) Perl
10 1 (0.39%) PHP
10 1 (0.39%) PL/SQL
10 1 (0.39%) ProC
10 1 (0.39%) Shell Script
Qualifications
1 85 (33.07%) Degree
2 34 (13.23%) Cisco Certification
3 31 (12.06%) CCNP
4 26 (10.12%) Security Cleared
5 18 (7.00%) PMI Certification
6 17 (6.61%) CISSP
7 16 (6.23%) A+ Certification
7 16 (6.23%) Computer Science Degree
8 15 (5.84%) CCIE
9 14 (5.45%) DV Cleared
10 12 (4.67%) CCNA
10 12 (4.67%) CISA
10 12 (4.67%) ISACA
11 11 (4.28%) PMP
12 9 (3.50%) CCSE
12 9 (3.50%) Master's Degree
13 8 (3.11%) CompTIA Security+
13 8 (3.11%) SC Cleared
14 7 (2.72%) GSEC
14 7 (2.72%) SSCP
Quality Assurance & Compliance
1 23 (8.95%) ITGC
2 18 (7.00%) QA
3 15 (5.84%) GDPR
4 8 (3.11%) Cyber Essentials
4 8 (3.11%) Cyber Essentials PLUS
4 8 (3.11%) NIST
5 7 (2.72%) MIL-STD-1553
6 5 (1.95%) Data Quality
7 4 (1.56%) ISO/IEC 27001
8 3 (1.17%) HIPAA
8 3 (1.17%) NIST 800
9 2 (0.78%) California Consumer Privacy Act
9 2 (0.78%) ISO/IEC 17025
9 2 (0.78%) NCSC
9 2 (0.78%) SLA
10 1 (0.39%) Accessibility
10 1 (0.39%) ISAE 3402
10 1 (0.39%) NEBOSH
System Software
1 12 (4.67%) Docker
2 6 (2.33%) Active Directory
2 6 (2.33%) VMware Infrastructure
3 2 (0.78%) Hyper-V
3 2 (0.78%) Virtual Desktop
3 2 (0.78%) Virtual Machines
3 2 (0.78%) VMware ESXi
4 1 (0.39%) VMware NSX
4 1 (0.39%) vSphere
Systems Management
1 19 (7.39%) Kubernetes
2 18 (7.00%) Terraform
3 12 (4.67%) Ansible
4 4 (1.56%) Cisco CUCM
5 3 (1.17%) Computer Incident Response Team
5 3 (1.17%) SCCM
6 2 (0.78%) Cisco UCCX
7 1 (0.39%) Cisco Prime
7 1 (0.39%) Kubeflow
7 1 (0.39%) WSUS
Vendors
1 51 (19.84%) SAP
2 42 (16.34%) Microsoft
3 38 (14.79%) Cisco
4 18 (7.00%) Google
4 18 (7.00%) Oracle
5 17 (6.61%) F5
6 15 (5.84%) CheckPoint
7 10 (3.89%) Arista
7 10 (3.89%) Fortinet
8 9 (3.50%) Palo Alto
9 8 (3.11%) VMware
10 7 (2.72%) Ariba
10 7 (2.72%) BT
11 5 (1.95%) SolarWinds
11 5 (1.95%) Vertica
12 4 (1.56%) Meraki
13 3 (1.17%) LogicMonitor
13 3 (1.17%) Openreach
13 3 (1.17%) Red Hat
14 2 (0.78%) BMC