Manufacturing Job Trends in Manchester

Manufacturing
North West > Manchester

The table below looks at the prevalence of the term Manufacturing in permanent job vacancies in Manchester. Included is a benchmarking guide to the salaries offered in vacancies that cited Manufacturing over the 6 months leading up to 5 November 2025, comparing them to the same period in the previous two years.

6 months to
5 Nov 2025
Same period 2024 Same period 2023
Rank 64 105 91
Rank change year-on-year +41 -14 +50
Permanent jobs citing Manufacturing 81 71 58
As % of all permanent jobs in Manchester 3.46% 1.95% 2.42%
As % of the General category 5.56% 3.30% 3.97%
Number of salaries quoted 69 31 49
10th Percentile £30,750 £25,000 £32,500
25th Percentile £33,750 £32,000 £47,500
Median annual salary (50th Percentile) £47,500 £44,000 £55,000
Median % change year-on-year +7.95% -20.00% -
75th Percentile £65,000 £60,000 £64,750
90th Percentile £74,200 £67,500 £73,600
North West median annual salary £47,500 £50,000 £52,500
% change year-on-year -5.00% -4.76% +5.00%

All General Skills
Manchester

Manufacturing falls under the General Skills category. For comparison with the information above, the following table provides summary statistics for all permanent job vacancies requiring common skills in Manchester.

Permanent vacancies with a requirement for common skills 1,456 2,152 1,461
As % of all permanent jobs advertised in Manchester 62.14% 58.98% 60.90%
Number of salaries quoted 869 841 1,142
10th Percentile £27,750 £30,000 £32,500
25th Percentile £32,500 £41,000 £43,000
Median annual salary (50th Percentile) £47,500 £53,159 £59,526
Median % change year-on-year -10.65% -10.70% +8.23%
75th Percentile £67,500 £68,750 £72,500
90th Percentile £82,750 £86,250 £84,056
North West median annual salary £46,500 £50,055 £55,000
% change year-on-year -7.10% -8.99% +4.76%

Manufacturing
Job Vacancy Trend in Manchester

Historical trend showing the proportion of permanent IT job postings citing Manufacturing relative to all permanent IT jobs advertised in Manchester.
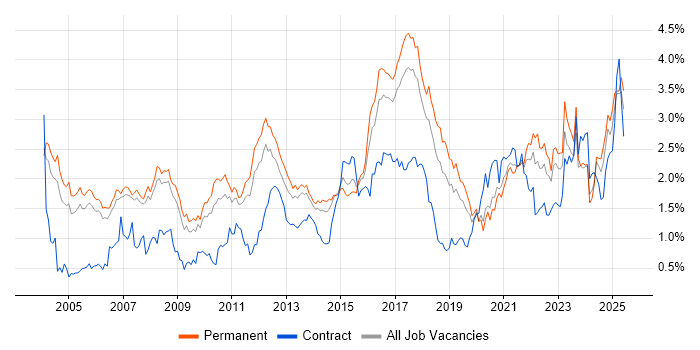
Manufacturing job vacancy trend in Manchester

Manufacturing
Salary Trend in Manchester

Salary distribution trend for jobs in Manchester citing Manufacturing.

Salary distribution trend for jobs in Manchester citing Manufacturing

Manufacturing
Salary Histogram in Manchester

Salary distribution for jobs citing Manufacturing in Manchester over the 6 months to 5 November 2025.

Salary histogram for Manufacturing in Manchester

Manufacturing
Job Locations in Manchester

The table below looks at the demand and provides a guide to the median salaries quoted in IT jobs citing Manufacturing within the Manchester region over the 6 months to 5 November 2025. The 'Rank Change' column provides an indication of the change in demand within each location based on the same 6 month period last year.

Location Rank Change
on Same Period
Last Year
Matching
Permanent
IT Job Ads
Median Salary
Past 6 Months
Median Salary
% Change
on Same Period
Last Year
Live
Jobs
Stockport - 10 £42,500 - 1
Rochdale +12 5 £47,500 -
Altrincham - 5 £25,000 - 1
Oldham +5 2 £40,000 -9.09%
Bolton +9 1 £47,500 - 10
Wigan +3 1 £47,500 -5.00% 3
Salford - 1 £45,000 -
Manufacturing
North West

Manufacturing
Co-Occurring Skills & Capabilities in Manchester by Category

The following tables expand on the one above by listing co-occurrences grouped by category. They cover the same employment type, locality and period, with up to 20 co-occurrences shown in each category:

Application Platforms
1 1 (1.23%) Confluence
1 1 (1.23%) WordPress
Applications
1 9 (11.11%) Microsoft Excel
2 6 (7.41%) Microsoft Office
3 5 (6.17%) AutoCAD
4 4 (4.94%) Autodesk Inventor
5 1 (1.23%) Siemens NX
Business Applications
1 4 (4.94%) NetSuite
2 3 (3.70%) Sage 200
2 3 (3.70%) Sage CRM
3 2 (2.47%) Sage X3
3 2 (2.47%) SAP S/4HANA
4 1 (1.23%) Payment Gateway
4 1 (1.23%) SAP IBP
4 1 (1.23%) SAP MII
4 1 (1.23%) SAP Oil and Gas
4 1 (1.23%) Teamcenter
Cloud Services
1 10 (12.35%) Power Platform
2 6 (7.41%) AWS
3 5 (6.17%) Azure
4 3 (3.70%) GCP
4 3 (3.70%) SaaS
5 2 (2.47%) AWS Lambda
5 2 (2.47%) Azure Data Factory
5 2 (2.47%) Azure Synapse Analytics
5 2 (2.47%) Serverless
5 2 (2.47%) Snowflake
6 1 (1.23%) BigCommerce
6 1 (1.23%) Dynamics 365
6 1 (1.23%) Google Analytics
6 1 (1.23%) PowerApps
Communications & Networking
1 3 (3.70%) LoRaWAN
2 1 (1.23%) Firewall
Database & Business Intelligence
1 10 (12.35%) Power BI
2 8 (9.88%) Tableau
3 7 (8.64%) PostgreSQL
4 3 (3.70%) MongoDB
5 2 (2.47%) Azure SQL Database
5 2 (2.47%) Big Data
5 2 (2.47%) Data Lake
5 2 (2.47%) Data Warehouse
5 2 (2.47%) SQL Server Analysis Services
5 2 (2.47%) SQL Server Integration Services
5 2 (2.47%) SQL Server Reporting Services
6 1 (1.23%) Qlik Sense
Development Applications
1 2 (2.47%) GitLab
1 2 (2.47%) Jenkins
1 2 (2.47%) Visual Studio
2 1 (1.23%) Gatling
2 1 (1.23%) JIRA
2 1 (1.23%) JMeter
2 1 (1.23%) LoadRunner
General
1 22 (27.16%) Social Skills
2 18 (22.22%) Finance
3 17 (20.99%) Electronics
4 12 (14.81%) Marketing
5 9 (11.11%) Analytical Skills
6 8 (9.88%) Pharmaceutical
7 7 (8.64%) Public Sector
7 7 (8.64%) Telecoms
8 6 (7.41%) Retail
9 3 (3.70%) Advertising
9 3 (3.70%) Billing
9 3 (3.70%) Organisational Skills
10 2 (2.47%) Military
11 1 (1.23%) Automotive
11 1 (1.23%) Banking
11 1 (1.23%) Games
11 1 (1.23%) Korean Language
11 1 (1.23%) Legal
11 1 (1.23%) Mandarin Language
11 1 (1.23%) Presentation Skills
Job Titles
1 14 (17.28%) Analyst
2 12 (14.81%) Technical Support
3 11 (13.58%) Support Engineer
4 7 (8.64%) Mathematician
4 7 (8.64%) Technical Engineer
4 7 (8.64%) Technical Support Engineer
5 6 (7.41%) Applications Support
5 6 (7.41%) Applications Support Analyst
5 6 (7.41%) Developer
5 6 (7.41%) ERP Analyst
5 6 (7.41%) ERP Support
5 6 (7.41%) Senior
5 6 (7.41%) Support Analyst
6 5 (6.17%) Consultant
6 5 (6.17%) Support Specialist
6 5 (6.17%) Technical Specialist
6 5 (6.17%) Technical Support Specialist
6 5 (6.17%) Test Engineer
7 4 (4.94%) 2nd Line Support
7 4 (4.94%) Linux Engineer
Libraries, Frameworks & Software Standards
1 3 (3.70%) FastAPI
1 3 (3.70%) Node.js
1 3 (3.70%) Spring
1 3 (3.70%) Spring Boot
2 2 (2.47%) WinForms
3 1 (1.23%) CSS
3 1 (1.23%) HTML
3 1 (1.23%) OAuth
3 1 (1.23%) OAuth2
3 1 (1.23%) PyTorch
3 1 (1.23%) React
3 1 (1.23%) RESTful
3 1 (1.23%) scikit-learn
3 1 (1.23%) TensorFlow
3 1 (1.23%) Vue
Miscellaneous
1 5 (6.17%) Driving Licence
2 4 (4.94%) Cloud Native
3 3 (3.70%) IoT
3 3 (3.70%) Renewable Energy
3 3 (3.70%) Self-Motivation
3 3 (3.70%) Social Media
4 2 (2.47%) Algorithms
4 2 (2.47%) Management Information System
5 1 (1.23%) Industry 4.0
5 1 (1.23%) Product Ownership
Operating Systems
1 11 (13.58%) Windows
2 7 (8.64%) Linux
3 1 (1.23%) CentOS
Processes & Methodologies
1 24 (29.63%) Business Intelligence
2 20 (24.69%) Problem-Solving
3 17 (20.99%) ERP
4 13 (16.05%) Analytics
4 13 (16.05%) Logistics
5 12 (14.81%) Decision-Making
6 9 (11.11%) AI
6 9 (11.11%) CAD
6 9 (11.11%) Master Data Management
7 8 (9.88%) Agile
7 8 (9.88%) Customer Service
7 8 (9.88%) DevOps
7 8 (9.88%) Digital Marketing
8 7 (8.64%) CRM
8 7 (8.64%) Mathematical Modelling
8 7 (8.64%) Mathematics
8 7 (8.64%) Programme Management
8 7 (8.64%) Root Cause Analysis
9 6 (7.41%) Change Management
9 6 (7.41%) Software Engineering
Programming Languages
1 15 (18.52%) SQL
2 10 (12.35%) C#
3 9 (11.11%) Python
4 5 (6.17%) Java
4 5 (6.17%) JavaScript
5 3 (3.70%) TypeScript
6 2 (2.47%) Ladder Logic
7 1 (1.23%) Data Analysis Expressions
7 1 (1.23%) PHP
7 1 (1.23%) PL/SQL
Qualifications
1 14 (17.28%) Degree
2 9 (11.11%) Security Cleared
3 7 (8.64%) DV Cleared
4 5 (6.17%) HND
5 2 (2.47%) ACCA
5 2 (2.47%) CIMA
5 2 (2.47%) Computer Science Degree
5 2 (2.47%) Master's Degree
5 2 (2.47%) SC Cleared
6 1 (1.23%) SAP Certification
Quality Assurance & Compliance
1 4 (4.94%) Data Quality
2 3 (3.70%) SLA
3 2 (2.47%) QA
4 1 (1.23%) Accessibility
System Software
1 1 (1.23%) Docker
Systems Management
1 1 (1.23%) Kubernetes
Vendors
1 19 (23.46%) Microsoft
1 19 (23.46%) SAP
2 5 (6.17%) Sage
3 4 (4.94%) Oracle
4 3 (3.70%) Rapid7
4 3 (3.70%) Siemens
5 1 (1.23%) Atlassian
5 1 (1.23%) Google
5 1 (1.23%) Instagram
5 1 (1.23%) Red Hat
5 1 (1.23%) Salesforce
5 1 (1.23%) TikTok
5 1 (1.23%) VMware
5 1 (1.23%) YouTube