GCP Jobs in the South East

Google Cloud Platform (GCP)
England > South East

The table below provides summary statistics for permanent job vacancies advertised in the South East requiring GCP skills. It includes a benchmarking guide to the annual salaries offered in vacancies that cited GCP over the 6 months leading up to 31 October 2024, comparing them to the same period in the previous two years.

6 months to
31 Oct 2024
Same period 2023 Same period 2022
Rank 120 149 145
Rank change year-on-year +29 -4 -22
Permanent jobs citing GCP 259 160 435
As % of all permanent jobs advertised in the South East 2.11% 1.95% 2.35%
As % of the Cloud Services category 7.73% 5.31% 6.39%
Number of salaries quoted 133 100 196
10th Percentile £41,732 £44,750 £41,250
25th Percentile £50,000 £56,563 £52,500
Median annual salary (50th Percentile) £60,000 £75,000 £65,000
Median % change year-on-year -20.00% +15.38% -3.70%
75th Percentile £80,000 £86,063 £80,000
90th Percentile £95,000 £97,500 £90,000
England median annual salary £85,000 £80,000 £80,000
% change year-on-year +6.25% - +6.67%

All Cloud Skills
South East

GCP falls under the Cloud Services category. For comparison with the information above, the following table provides summary statistics for all permanent job vacancies requiring cloud computing skills in the South East.

Permanent vacancies with a requirement for cloud computing skills 3,349 3,015 6,803
As % of all permanent jobs advertised in the South East 27.24% 36.74% 36.78%
Number of salaries quoted 1,832 2,349 4,717
10th Percentile £35,000 £30,000 £30,000
25th Percentile £42,500 £40,000 £41,250
Median annual salary (50th Percentile) £57,500 £55,000 £57,500
Median % change year-on-year +4.55% -4.35% +4.55%
75th Percentile £73,375 £70,500 £73,750
90th Percentile £83,750 £82,500 £85,000
England median annual salary £65,000 £62,500 £64,500
% change year-on-year +4.00% -3.10% +7.50%

GCP
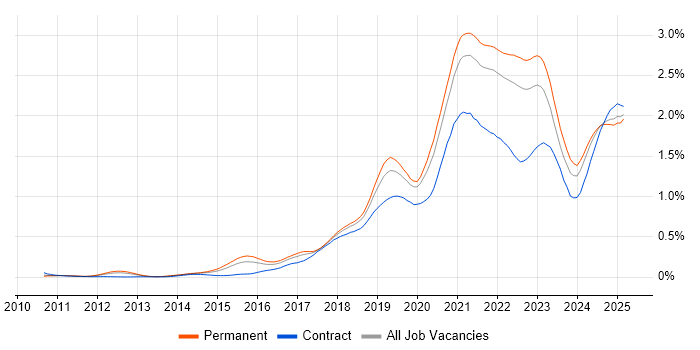
Job Vacancy Trend in the South East

Job postings citing GCP as a proportion of all IT jobs advertised in the South East.

Job vacancy trend for GCP in the South East

GCP
Salary Trend in the South East

3-month moving average salary quoted in jobs citing GCP in the South East.

Salary trend for GCP in the South East

GCP
Salary Histogram in the South East

Salary distribution for jobs citing GCP in the South East over the 6 months to 31 October 2024.

Salary histogram for GCP in the South East

GCP
Job Locations in the South East

The table below looks at the demand and provides a guide to the median salaries quoted in IT jobs citing GCP within the South East region over the 6 months to 31 October 2024. The 'Rank Change' column provides an indication of the change in demand within each location based on the same 6 month period last year.

Location Rank Change
on Same Period
Last Year
Matching
Permanent
IT Job Ads
Median Salary
Past 6 Months
Median Salary
% Change
on Same Period
Last Year
Live
Jobs
Hampshire -12 94 £60,000 -20.00% 15
Thames Valley -3 65 £56,509 -24.66% 14
East Sussex +40 41 £47,500 -17.39% 4
Oxfordshire +4 31 £44,089 -34.68% 2
Surrey -10 29 £87,500 +50.86% 7
Kent -13 25 £50,000 -37.50% 1
Berkshire -2 24 £80,000 +3.23% 6
Buckinghamshire -23 10 £65,000 -13.33% 6
West Sussex +10 3 £72,418 +60.93% 1
Middlesex - 1 - -
GCP
England

GCP
Co-occurring Skills and Capabilities in the South East by Category

The follow tables expand on the table above by listing co-occurrences grouped by category. The same employment type, locality and period is covered with up to 20 co-occurrences shown in each of the following categories:

Application Platforms
1 7 (2.70%) Apache
1 7 (2.70%) Apache Airflow
2 3 (1.16%) Apache Spark
2 3 (1.16%) CMS
2 3 (1.16%) Sitecore CMS
3 2 (0.77%) Microsoft Exchange
3 2 (0.77%) SharePoint
Applications
1 10 (3.86%) Microsoft Office
2 1 (0.39%) Microsoft Excel
2 1 (0.39%) Microsoft PowerPoint
2 1 (0.39%) Microsoft Project
2 1 (0.39%) Revit
Business Applications
1 2 (0.77%) SAP S/4HANA
2 1 (0.39%) Remedy ITSM
Cloud Services
1 157 (60.62%) AWS
2 131 (50.58%) Azure
3 17 (6.56%) SaaS
4 13 (5.02%) Microsoft 365
5 11 (4.25%) GitHub
6 8 (3.09%) DigitalOcean
7 7 (2.70%) GitHub Actions
8 5 (1.93%) Cloud Computing
9 4 (1.54%) OpenShift
10 3 (1.16%) Algolia
10 3 (1.16%) Contentful
10 3 (1.16%) Google Analytics
10 3 (1.16%) Google Sheets
10 3 (1.16%) Serverless
11 2 (0.77%) AWS CloudFormation
11 2 (0.77%) Azure Cognitive Services
11 2 (0.77%) Azure DevOps
11 2 (0.77%) Google Play
11 2 (0.77%) Nutanix
11 2 (0.77%) Pulumi
Communications & Networking
1 37 (14.29%) Broadband
2 22 (8.49%) Firewall
3 14 (5.41%) TCP/IP
4 13 (5.02%) Network Security
5 12 (4.63%) DHCP
5 12 (4.63%) DNS
6 9 (3.47%) VPN
7 6 (2.32%) VLAN
8 5 (1.93%) WAN
9 4 (1.54%) BGP
9 4 (1.54%) OSPF
10 3 (1.16%) LAN
11 1 (0.39%) Cisco ASA
11 1 (0.39%) EIGRP
11 1 (0.39%) HTTP
11 1 (0.39%) Intrusion Detection
11 1 (0.39%) IPsec
11 1 (0.39%) MPLS
11 1 (0.39%) Reverse Proxy
11 1 (0.39%) SSL
Database & Business Intelligence
1 37 (14.29%) Data Hub
2 36 (13.90%) MySQL
3 25 (9.65%) BigQuery
4 20 (7.72%) Data Warehouse
5 10 (3.86%) SQL Server
6 8 (3.09%) Data Mart
6 8 (3.09%) NoSQL
6 8 (3.09%) Semantic Layer
7 7 (2.70%) Looker
8 6 (2.32%) MongoDB
9 4 (1.54%) Big Data
9 4 (1.54%) DynamoDB
9 4 (1.54%) PostgreSQL
10 3 (1.16%) Data Mining
10 3 (1.16%) Hadoop
11 2 (0.77%) Azure SQL Database
11 2 (0.77%) Data Lake
11 2 (0.77%) SQLite
12 1 (0.39%) OLAP
12 1 (0.39%) OLTP
Development Applications
1 46 (17.76%) Git
2 23 (8.88%) PHPUnit
2 23 (8.88%) Selenium
3 9 (3.47%) GitLab
4 8 (3.09%) Jenkins
5 5 (1.93%) JIRA
6 3 (1.16%) Visual Website Optimizer
7 2 (0.77%) Bitbucket
7 2 (0.77%) Burp Suite
7 2 (0.77%) Metasploit
8 1 (0.39%) Artifactory
8 1 (0.39%) CircleCI
8 1 (0.39%) SonarQube
8 1 (0.39%) Terragrunt
8 1 (0.39%) Visual Studio
General
1 74 (28.57%) Social Skills
2 51 (19.69%) Finance
3 37 (14.29%) Influencing Skills
4 21 (8.11%) Analytical Skills
5 17 (6.56%) Public Sector
6 16 (6.18%) Advertising
7 13 (5.02%) Organisational Skills
8 10 (3.86%) Inclusion and Diversity
8 10 (3.86%) Retail
9 9 (3.47%) Marketing
10 5 (1.93%) Telecoms
11 3 (1.16%) Presentation Skills
12 2 (0.77%) Banking
12 2 (0.77%) Billing
12 2 (0.77%) Law
13 1 (0.39%) Documentation Skills
13 1 (0.39%) Health Technology
13 1 (0.39%) Manufacturing
13 1 (0.39%) Retail Banking
13 1 (0.39%) Retail Finance
Job Titles
1 96 (37.07%) Senior
2 49 (18.92%) Analyst
3 47 (18.15%) Senior Analyst
4 40 (15.44%) Architect
5 33 (12.74%) Audit Analyst
5 33 (12.74%) IT Analyst
6 31 (11.97%) Developer
7 26 (10.04%) Data Architect
8 24 (9.27%) Software Engineer
9 14 (5.41%) Data Engineer
10 13 (5.02%) Senior Data Engineer
10 13 (5.02%) Senior Developer
11 12 (4.63%) Infrastructure Engineer
12 11 (4.25%) Cloud Engineer
12 11 (4.25%) IT Engineer
12 11 (4.25%) IT Support
12 11 (4.25%) IT Support Engineer
12 11 (4.25%) Support Engineer
13 10 (3.86%) IT Systems Administrator
13 10 (3.86%) Systems Administrator
Libraries, Frameworks & Software Standards
1 14 (5.41%) LAMP
2 13 (5.02%) React
3 11 (4.25%) CSS
4 8 (3.09%) .NET
4 8 (3.09%) HTML
4 8 (3.09%) Kafka
5 7 (2.70%) AngularJS
6 6 (2.32%) EDI
6 6 (2.32%) Node.js
7 5 (1.93%) ASP.NET
7 5 (1.93%) ASP.NET Core
7 5 (1.93%) RabbitMQ
7 5 (1.93%) Spring
8 4 (1.54%) .NET Core
8 4 (1.54%) ASP.NET Web API
8 4 (1.54%) Next.js
8 4 (1.54%) React Native
8 4 (1.54%) RESTful
8 4 (1.54%) Tailwind CSS
9 3 (1.16%) Ionic Framework
Miscellaneous
1 23 (8.88%) Cybercrime
2 18 (6.95%) Product Ownership
3 14 (5.41%) Management Information System
4 8 (3.09%) Blog
4 8 (3.09%) Digital Media
4 8 (3.09%) Greenfield Project
4 8 (3.09%) Mobile App
5 7 (2.70%) Algorithms
6 4 (1.54%) Analytical Mindset
6 4 (1.54%) Cloud Native
6 4 (1.54%) Public Cloud
6 4 (1.54%) Security Posture
6 4 (1.54%) Self-Motivation
7 3 (1.16%) CUDA
7 3 (1.16%) Cyberattack
7 3 (1.16%) Distributed Computing
7 3 (1.16%) Fat Client
7 3 (1.16%) Thin Client
8 2 (0.77%) Data Centre
9 1 (0.39%) Hybrid Cloud
Operating Systems
1 20 (7.72%) Linux
2 18 (6.95%) Windows
3 4 (1.54%) Android
3 4 (1.54%) Embedded Linux
3 4 (1.54%) Unix
4 3 (1.16%) Apple iOS
4 3 (1.16%) VMS
4 3 (1.16%) Windows Server
5 1 (0.39%) CentOS
5 1 (0.39%) Mac OS
5 1 (0.39%) Windows Server 2016
5 1 (0.39%) Windows Server 2019
Processes & Methodologies
1 82 (31.66%) Problem-Solving
2 67 (25.87%) Agile
3 64 (24.71%) Analytics
4 59 (22.78%) Continuous Improvement
5 50 (19.31%) Software Engineering
6 49 (18.92%) Data Governance
7 45 (17.37%) Customer Experience
8 43 (16.60%) Cybersecurity
9 39 (15.06%) Data Analysis
10 38 (14.67%) Data Management
10 38 (14.67%) Data Transformation
11 35 (13.51%) Migration
12 33 (12.74%) IT Audit
13 32 (12.36%) Data Strategy
13 32 (12.36%) DevOps
14 30 (11.58%) Mentoring
14 30 (11.58%) TDD
15 29 (11.20%) Coaching
15 29 (11.20%) Load Balancing
15 29 (11.20%) OOP
Programming Languages
1 43 (16.60%) Python
2 39 (15.06%) PHP
3 25 (9.65%) SQL
4 20 (7.72%) C++
4 20 (7.72%) Go
5 17 (6.56%) Bash
6 15 (5.79%) Java
6 15 (5.79%) JavaScript
7 12 (4.63%) PowerShell
8 11 (4.25%) C
9 6 (2.32%) C#
10 3 (1.16%) C-shell
10 3 (1.16%) Fortran
10 3 (1.16%) R
11 2 (0.77%) Objective-C
11 2 (0.77%) TypeScript
11 2 (0.77%) XAML
12 1 (0.39%) AWK
12 1 (0.39%) MATLAB
12 1 (0.39%) Shell Script
Qualifications
1 49 (18.92%) Degree
2 41 (15.83%) Security Cleared
3 37 (14.29%) CISA
4 31 (11.97%) SC Cleared
5 26 (10.04%) DV Cleared
6 15 (5.79%) Computer Science Degree
7 14 (5.41%) Cisco Certification
8 13 (5.02%) DBS Check
9 12 (4.63%) CCNA
10 11 (4.25%) Microsoft Certification
11 10 (3.86%) A+ Certification
11 10 (3.86%) MCP
12 8 (3.09%) CISSP
13 7 (2.70%) Azure Certification
13 7 (2.70%) Master's Degree
14 6 (2.32%) AWS Certification
14 6 (2.32%) BPSS Clearance
15 5 (1.93%) CCNP
16 4 (1.54%) PhD
17 3 (1.16%) Network+ Certification
Quality Assurance & Compliance
1 38 (14.67%) Sarbanes-Oxley
2 12 (4.63%) Accessibility
3 11 (4.25%) Data Quality
4 8 (3.09%) PCI DSS
5 5 (1.93%) GDPR
5 5 (1.93%) ISO/IEC 27001
6 4 (1.54%) NIST
7 3 (1.16%) SOC 2
8 1 (0.39%) COBIT
8 1 (0.39%) HIPAA
8 1 (0.39%) QA
System Software
1 59 (22.78%) Docker
2 14 (5.41%) Active Directory
3 13 (5.02%) VMware Infrastructure
4 3 (1.16%) Firmware
4 3 (1.16%) Hyper-V
5 1 (0.39%) KVM
5 1 (0.39%) Virtual Desktop
5 1 (0.39%) vSphere
Systems Management
1 50 (19.31%) Kubernetes
2 19 (7.34%) Ansible
3 15 (5.79%) Terraform
4 8 (3.09%) Argo
5 4 (1.54%) Puppet
6 2 (0.77%) Nmap
7 1 (0.39%) Active Directory Federation Services
7 1 (0.39%) Grafana
7 1 (0.39%) Graphite
7 1 (0.39%) Nagios
7 1 (0.39%) Prometheus
7 1 (0.39%) SCCM
7 1 (0.39%) VxRail
7 1 (0.39%) ZABBIX
Vendors
1 115 (44.40%) Google
2 23 (8.88%) Microsoft
3 13 (5.02%) VMware
4 10 (3.86%) Cisco
5 8 (3.09%) Dynatrace
6 6 (2.32%) Salesforce
7 4 (1.54%) NVIDIA
7 4 (1.54%) Palo Alto
7 4 (1.54%) RedGate
8 3 (1.16%) Foundry
8 3 (1.16%) Hotjar
8 3 (1.16%) IBM
8 3 (1.16%) Meraki
8 3 (1.16%) Netlify
8 3 (1.16%) Oracle
8 3 (1.16%) Palantir
8 3 (1.16%) Sitecore
9 2 (0.77%) HP
9 2 (0.77%) SAP
9 2 (0.77%) Xamarin