Software Engineer Jobs in the UK excluding London

Software Engineer
UK > UK excluding London

The median Software Engineer salary in the UK excluding London is £60,000 per year, according to job vacancies posted during the 6 months leading to 31 October 2024.

The table below provides salary benchmarking and summary statistics, comparing them to the same period in the previous two years.

6 months to
31 Oct 2024
Same period 2023 Same period 2022
Rank 25 50 36
Rank change year-on-year +25 -14 +12
Permanent jobs requiring a Software Engineer 3,404 1,806 4,962
As % of all permanent jobs advertised in the UK excluding London 6.27% 5.31% 7.20%
As % of the Job Titles category 6.63% 5.53% 7.55%
Number of salaries quoted 1,826 1,102 2,165
10th Percentile £40,000 £41,000 £37,156
25th Percentile £45,000 £47,500 £45,000
Median annual salary (50th Percentile) £60,000 £60,000 £57,500
Median % change year-on-year - +4.35% +9.52%
75th Percentile £70,000 £71,250 £72,500
90th Percentile £80,000 £82,500 £81,250
UK median annual salary £65,000 £67,500 £67,500
% change year-on-year -3.70% - +12.50%

All Permanent IT Job Vacancies
UK excluding London

For comparison with the information above, the following table provides summary statistics for all permanent IT job vacancies in the UK excluding London. Most job vacancies include a discernible job title that can be normalized. As such, the figures in the second row provide an indication of the number of permanent jobs in our overall sample.

Permanent vacancies in the UK excluding London with a recognized job title 51,365 32,680 65,758
% of permanent jobs with a recognized job title 94.64% 96.01% 95.44%
Number of salaries quoted 25,610 22,460 39,045
10th Percentile £30,000 £28,000 £30,000
25th Percentile £40,000 £37,871 £38,750
Median annual salary (50th Percentile) £50,404 £52,500 £52,500
Median % change year-on-year -3.99% - +5.00%
75th Percentile £65,000 £67,500 £68,750
90th Percentile £80,000 £80,000 £82,500
UK median annual salary £56,525 £60,000 £60,000
% change year-on-year -5.79% - +4.35%

Software Engineer
Job Vacancy Trend in the UK excluding London

Job postings that featured Software Engineer in the job title as a proportion of all IT jobs advertised in the UK excluding London.
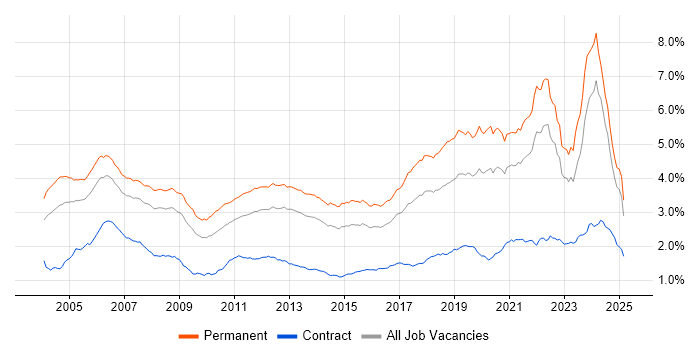
Job vacancy trend for Software Engineer in the UK excluding London

Software Engineer
Salary Trend in the UK excluding London

3-month moving average salary quoted in jobs citing Software Engineer in the UK excluding London.

Salary trend for Software Engineer in the UK excluding London

Software Engineer
Salary Histogram in the UK excluding London

Salary distribution for jobs citing Software Engineer in the UK excluding London over the 6 months to 31 October 2024.

Salary histogram for Software Engineer in the UK excluding London

Software Engineer
Job Locations in the UK excluding London

The table below looks at the demand and provides a guide to the median salaries quoted in IT jobs citing Software Engineer within the UK excluding London region over the 6 months to 31 October 2024. The 'Rank Change' column provides an indication of the change in demand within each location based on the same 6 month period last year.

Location Rank Change
on Same Period
Last Year
Matching
Permanent
IT Job Ads
Median Salary
Past 6 Months
Median Salary
% Change
on Same Period
Last Year
Live
Jobs
South East +48 915 £55,000 -8.33% 152
North of England +17 711 £60,000 - 143
South West +27 610 £60,000 - 129
North West +20 414 £60,000 -1.64% 83
Midlands +28 397 £50,000 -13.04% 94
East of England +45 336 £65,000 - 70
Scotland -5 309 £60,000 +4.35% 41
Yorkshire +14 218 £55,250 -7.92% 41
East Midlands +14 205 £50,000 -9.09% 46
West Midlands +12 192 £64,250 +11.74% 48
Wales +40 88 £60,000 +26.32% 16
North East +3 79 £56,000 +1.82% 19
Northern Ireland -1 35 £75,000 +25.00% 13
Isle of Man - 3 £36,000 -
Software Engineer
UK

Software Engineer Skill Set
Top 30 Co-occurring Skills and Capabilities in the UK excluding London

For the 6 months to 31 October 2024, Software Engineer job roles required the following skills and capabilities in order of popularity. The figures indicate the absolute number co-occurrences and as a proportion of all permanent job ads across the UK excluding London region featuring Software Engineer in the job title.

1 3,398 (99.82%) Software Engineering
2 890 (26.15%) Agile
3 825 (24.24%) C++
4 781 (22.94%) C#
5 751 (22.06%) Python
6 714 (20.98%) AWS
7 593 (17.42%) Degree
8 557 (16.36%) C
9 542 (15.92%) Java
10 497 (14.60%) .NET
11 494 (14.51%) React
12 482 (14.16%) Azure
13 473 (13.90%) JavaScript
13 473 (13.90%) Linux
14 444 (13.04%) TypeScript
15 397 (11.66%) Problem-Solving
16 395 (11.60%) SQL
17 376 (11.05%) Full-Stack Development
18 371 (10.90%) Docker
19 361 (10.61%) DevOps
20 359 (10.55%) Security Cleared
21 353 (10.37%) Computer Science
22 338 (9.93%) Kubernetes
23 332 (9.75%) AngularJS
24 325 (9.55%) Social Skills
25 317 (9.31%) Mentoring
26 314 (9.22%) User Experience
27 311 (9.14%) Inclusion and Diversity
28 296 (8.70%) PostgreSQL
29 286 (8.40%) CI/CD

Software Engineer Skill Set
Co-occurring Skills and Capabilities in the UK excluding London by Category

The follow tables expand on the table above by listing co-occurrences grouped by category. The same employment type, locality and period is covered with up to 20 co-occurrences shown in each of the following categories:

Application Platforms
1 33 (0.97%) WinCC
2 26 (0.76%) Apache
3 25 (0.73%) Confluence
4 12 (0.35%) CMS
5 11 (0.32%) Tuxedo
6 10 (0.29%) Apache Spark
7 4 (0.12%) Appian
7 4 (0.12%) nginx
7 4 (0.12%) NServiceBus
7 4 (0.12%) Tomcat
8 2 (0.059%) Apache Airflow
8 2 (0.059%) Microsoft Exchange
8 2 (0.059%) Solana
8 2 (0.059%) Umbraco
9 1 (0.029%) Apache Solr
9 1 (0.029%) Drupal
9 1 (0.029%) JBoss
Applications
1 64 (1.88%) Simulink
2 30 (0.88%) CPLEX
3 8 (0.24%) Stateflow
4 7 (0.21%) AutoCAD
5 5 (0.15%) OrCAD
6 4 (0.12%) Adobe XD
6 4 (0.12%) CANalyzer
7 3 (0.088%) Microsoft Office
8 2 (0.059%) Autodesk Inventor
8 2 (0.059%) Chatbot
8 2 (0.059%) Fusion 360
8 2 (0.059%) Revit
9 1 (0.029%) GNU Octave
9 1 (0.029%) Microsoft Excel
9 1 (0.029%) Microsoft PowerPoint
Business Applications
1 6 (0.18%) Dynamics CRM
2 4 (0.12%) C-CURE
2 4 (0.12%) SAP S/4HANA
3 2 (0.059%) ResourceLink
Cloud Services
1 714 (20.98%) AWS
2 482 (14.16%) Azure
3 228 (6.70%) GitHub
4 201 (5.90%) Serverless
5 191 (5.61%) Amazon Kinesis
6 157 (4.61%) AWS Lambda
7 153 (4.49%) Amazon S3
8 147 (4.32%) Amazon SQS
9 114 (3.35%) GCP
10 101 (2.97%) Azure DevOps
11 57 (1.67%) ChatGPT
12 54 (1.59%) Anthropic Claude
13 53 (1.56%) SaaS
14 47 (1.38%) GitHub Actions
15 30 (0.88%) Azure Service Bus
16 26 (0.76%) Azure API Management
17 21 (0.62%) Azure Data Factory
18 20 (0.59%) Azure Cosmos DB
18 20 (0.59%) Azure Synapse Analytics
19 18 (0.53%) Power Platform
Communications & Networking
1 53 (1.56%) Network Security
2 47 (1.38%) TCP/IP
3 34 (1.00%) Wireless
4 32 (0.94%) Ethernet
5 27 (0.79%) RS-232
6 22 (0.65%) HTTP
7 20 (0.59%) Software-Defined Radio
8 19 (0.56%) RS-485
9 18 (0.53%) Bluetooth
10 16 (0.47%) Modbus
10 16 (0.47%) MQTT
11 14 (0.41%) Wi-Fi
12 10 (0.29%) Firewall
13 9 (0.26%) Internet
14 8 (0.24%) DNS
14 8 (0.24%) VoIP
15 6 (0.18%) IPv6
15 6 (0.18%) Reverse Proxy
15 6 (0.18%) SMTP
15 6 (0.18%) SNMP
Database & Business Intelligence
1 296 (8.70%) PostgreSQL
2 199 (5.85%) DynamoDB
3 189 (5.55%) Redis
4 134 (3.94%) NoSQL
5 98 (2.88%) SQL Server
6 64 (1.88%) MySQL
7 53 (1.56%) MongoDB
8 52 (1.53%) Relational Database
9 42 (1.23%) Amazon Aurora
10 34 (1.00%) Elasticsearch
11 33 (0.97%) Azure SQL Database
12 21 (0.62%) Big Data
13 19 (0.56%) SQLite
14 16 (0.47%) Hadoop
15 11 (0.32%) DB2
16 10 (0.29%) Amazon RDS
17 9 (0.26%) QGIS
18 8 (0.24%) Power BI
18 8 (0.24%) RDBMS
19 7 (0.21%) Sybase IQ
Development Applications
1 216 (6.35%) Git
2 202 (5.93%) Jenkins
3 64 (1.88%) JIRA
4 63 (1.85%) GitLab
5 48 (1.41%) LabVIEW
5 48 (1.41%) Visual Studio
6 36 (1.06%) Subversion
7 34 (1.00%) Gatling
8 32 (0.94%) Vagrant
9 18 (0.53%) Selenium
10 17 (0.50%) Bitbucket
11 16 (0.47%) Cucumber
11 16 (0.47%) Cypress.io
12 15 (0.44%) CMake
13 14 (0.41%) CircleCI
13 14 (0.41%) Rational Rhapsody
14 13 (0.38%) NetBeans
15 11 (0.32%) Eclipse
15 11 (0.32%) Rational DOORS
16 10 (0.29%) Eclipse RCP
General
1 325 (9.55%) Social Skills
2 311 (9.14%) Inclusion and Diversity
3 274 (8.05%) Electronics
4 176 (5.17%) Manufacturing
5 168 (4.94%) Marketing
6 165 (4.85%) Advertising
7 160 (4.70%) Finance
8 139 (4.08%) Automotive
9 95 (2.79%) Analytical Skills
10 92 (2.70%) Aerospace
11 59 (1.73%) Public Sector
12 54 (1.59%) Military
13 49 (1.44%) Retail
14 47 (1.38%) Legal
15 44 (1.29%) Pharmaceutical
15 44 (1.29%) Tech for Good
15 44 (1.29%) Telecoms
16 34 (1.00%) Law
17 27 (0.79%) Banking
18 24 (0.71%) Games
Libraries, Frameworks & Software Standards
1 497 (14.60%) .NET
2 494 (14.51%) React
3 332 (9.75%) AngularJS
4 275 (8.08%) Node.js
5 257 (7.55%) REST
6 188 (5.52%) HTML
7 169 (4.96%) CSS
8 155 (4.55%) WPF
9 152 (4.47%) Tailwind CSS
10 123 (3.61%) .NET Framework
11 121 (3.55%) ASP.NET
12 108 (3.17%) .NET Core
13 92 (2.70%) RESTful
14 81 (2.38%) GraphQL
15 78 (2.29%) Blazor
15 78 (2.29%) Vue
16 73 (2.14%) Spring
17 70 (2.06%) Web Services
18 69 (2.03%) Middleware
19 58 (1.70%) Qt
Miscellaneous
1 196 (5.76%) Blog
2 144 (4.23%) Digital Media
3 123 (3.61%) Algorithms
4 101 (2.97%) Embedded Systems
5 97 (2.85%) Cyberattack
6 79 (2.32%) Robotics
7 75 (2.20%) Greenfield Project
8 72 (2.12%) Distributed Systems
9 64 (1.88%) Product Ownership
10 63 (1.85%) Self-Motivation
11 59 (1.73%) Media Streaming
12 43 (1.26%) IoT
13 26 (0.76%) FPGA
13 26 (0.76%) Public Cloud
14 25 (0.73%) VHDL
15 24 (0.71%) Acoustics
15 24 (0.71%) Cloud Native
15 24 (0.71%) Device Driver
16 23 (0.68%) Renewable Energy
17 20 (0.59%) Linux Command Line
Operating Systems
1 473 (13.90%) Linux
2 191 (5.61%) Windows
3 90 (2.64%) Embedded Linux
4 68 (2.00%) Android
5 65 (1.91%) Unix
6 43 (1.26%) Red Hat Enterprise Linux
7 35 (1.03%) Ubuntu
8 34 (1.00%) CentOS
9 19 (0.56%) FreeRTOS
10 16 (0.47%) Apple iOS
10 16 (0.47%) VxWorks
11 10 (0.29%) Windows Server
12 7 (0.21%) Debian
13 4 (0.12%) Rocky
14 3 (0.088%) Alpine Linux
14 3 (0.088%) Windows Embedded Compact
15 2 (0.059%) Mac OS
15 2 (0.059%) Windows 10
16 1 (0.029%) Robot Operating System
16 1 (0.029%) zOS
Processes & Methodologies
1 3,398 (99.82%) Software Engineering
2 890 (26.15%) Agile
3 397 (11.66%) Problem-Solving
4 376 (11.05%) Full-Stack Development
5 361 (10.61%) DevOps
6 353 (10.37%) Computer Science
7 317 (9.31%) Mentoring
8 314 (9.22%) User Experience
9 286 (8.40%) CI/CD
10 283 (8.31%) Scrum
11 273 (8.02%) Artificial Intelligence
12 262 (7.70%) Machine Learning
13 227 (6.67%) Microservices
14 221 (6.49%) TDD
15 210 (6.17%) Mathematics
16 205 (6.02%) OO
17 200 (5.88%) SDLC
18 195 (5.73%) Software Testing
19 177 (5.20%) Unit Testing
20 174 (5.11%) Test Automation
Programming Languages
1 825 (24.24%) C++
2 781 (22.94%) C#
3 751 (22.06%) Python
4 557 (16.36%) C
5 542 (15.92%) Java
6 473 (13.90%) JavaScript
7 444 (13.04%) TypeScript
8 395 (11.60%) SQL
9 109 (3.20%) Embedded C
10 87 (2.56%) MATLAB
11 78 (2.29%) Go
12 77 (2.26%) Bash
13 75 (2.20%) PHP
14 73 (2.14%) Rust
15 69 (2.03%) Kotlin
15 69 (2.03%) Scala
16 62 (1.82%) Embedded C++
17 53 (1.56%) Fortran
18 47 (1.38%) Perl
19 32 (0.94%) PowerShell
Qualifications
1 593 (17.42%) Degree
2 359 (10.55%) Security Cleared
3 190 (5.58%) SC Cleared
4 185 (5.43%) Computer Science Degree
5 124 (3.64%) DV Cleared
6 81 (2.38%) Master's Degree
7 65 (1.91%) PhD
8 19 (0.56%) Azure Certification
9 9 (0.26%) HND
10 8 (0.24%) BPSS Clearance
10 8 (0.24%) PMI Certification
11 7 (0.21%) Microsoft Certification
12 5 (0.15%) Chartered Engineer
13 4 (0.12%) Numerate Degree
14 3 (0.088%) AWS Certification
14 3 (0.088%) AWS Certified Cloud Practitioner
14 3 (0.088%) AWS Certified Developer
14 3 (0.088%) AWS Certified Solutions Architect
15 1 (0.029%) HNC
Quality Assurance & Compliance
1 76 (2.23%) QA
2 22 (0.65%) ISO 26262
3 21 (0.62%) Accessibility
4 19 (0.56%) MISRA
5 17 (0.50%) AUTOSAR
5 17 (0.50%) IEC 61131
6 13 (0.38%) ISO 9001
7 12 (0.35%) MISRA C
8 10 (0.29%) Def Stans
8 10 (0.29%) IEC 61508
9 8 (0.24%) IEC 62304
9 8 (0.24%) TickIT
10 6 (0.18%) ISO 13485
10 6 (0.18%) SLA
11 5 (0.15%) PCI DSS
12 4 (0.12%) DO-178B
12 4 (0.12%) GDPR
12 4 (0.12%) ISO/IEC 27001
12 4 (0.12%) JTAG
13 3 (0.088%) PMO
System Software
1 371 (10.90%) Docker
2 134 (3.94%) Firmware
3 58 (1.70%) Embedded Firmware
4 13 (0.38%) Virtual Machines
5 5 (0.15%) Virtual Servers
6 4 (0.12%) VMware Infrastructure
7 2 (0.059%) Active Directory
7 2 (0.059%) Hyper-V
7 2 (0.059%) Microsoft Virtual Server
Systems Management
1 338 (9.93%) Kubernetes
2 135 (3.97%) Terraform
3 69 (2.03%) Ansible
4 12 (0.35%) Grafana
4 12 (0.35%) Puppet
5 8 (0.24%) Kibana
6 7 (0.21%) Prometheus
7 6 (0.18%) Progress Chef
8 4 (0.12%) Packer
9 2 (0.059%) Single Sign-On
Vendors
1 195 (5.73%) Microsoft
2 49 (1.44%) Google
3 38 (1.12%) Siemens
4 29 (0.85%) Xilinx
5 26 (0.76%) Databricks
6 24 (0.71%) Oracle
7 23 (0.68%) Atlassian
8 14 (0.41%) Wind River
9 12 (0.35%) Salesforce
10 11 (0.32%) Micro Focus
10 11 (0.32%) SAP
11 10 (0.29%) IBM
12 9 (0.26%) Red Hat
12 9 (0.26%) Splunk
13 8 (0.24%) Serena
13 8 (0.24%) Sybase
14 6 (0.18%) Intel
14 6 (0.18%) Motorola
14 6 (0.18%) NVIDIA
14 6 (0.18%) YouTube