Actionable Insights (or Actionable Intelligence, Actionable Recommendations)
UK

The following table provides summary statistics for permanent job vacancies with a requirement for Actionable Insight skills. Included is a benchmarking guide to the salaries offered in vacancies that have cited Actionable Insight over the 6 months to 27 April 2024 with a comparison to the same period in the previous 2 years.

6 months to
27 Apr 2024
Same period 2023 Same period 2022
Rank 55 82 462
Rank change year-on-year +27 +380 +68
Permanent jobs citing Actionable Insight 4,359 4,111 1,199
As % of all permanent jobs advertised in the UK 4.45% 3.93% 0.78%
As % of the Processes & Methodologies category 5.17% 4.11% 0.81%
Number of salaries quoted 561 246 338
10th Percentile £31,250 £34,236 £35,000
25th Percentile £42,250 £43,750 £42,500
Median annual salary (50th Percentile) £52,500 £55,065 £55,000
Median % change year-on-year -4.66% +0.12% -
75th Percentile £66,250 £70,000 £73,750
90th Percentile £78,750 £82,500 £91,625
UK excluding London median annual salary £50,000 £52,000 £47,500
% change year-on-year -3.85% +9.47% -2.56%

All Process and Methodology Skills
UK

Actionable Insight is in the Processes and Methodologies category. The following table is for comparison with the above and provides summary statistics for all permanent job vacancies with a requirement for process or methodology skills.

Permanent vacancies with a requirement for process or methodology skills 84,305 100,095 147,310
As % of all permanent jobs advertised in the UK 85.99% 95.64% 95.57%
Number of salaries quoted 59,591 58,745 83,129
10th Percentile £29,000 £34,000 £33,500
25th Percentile £40,000 £45,000 £43,750
Median annual salary (50th Percentile) £55,000 £62,000 £60,000
Median % change year-on-year -11.29% +3.33% +9.09%
75th Percentile £72,500 £82,500 £80,000
90th Percentile £92,500 £100,000 £96,250
UK excluding London median annual salary £50,000 £55,000 £52,500
% change year-on-year -9.09% +4.76% +9.38%

Actionable Insight
Job Vacancy Trend

Job postings citing Actionable Insight as a proportion of all IT jobs advertised.
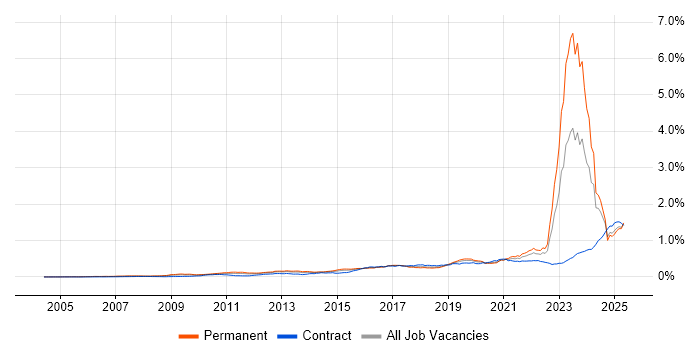
Job vacancy trend for Actionable Insight in the UK

Actionable Insight
Salary Trend

3-month moving average salary quoted in jobs citing Actionable Insight.

Salary trend for Actionable Insight in the UK

Actionable Insight
Salary Histogram

Salary distribution for jobs citing Actionable Insight over the 6 months to 27 April 2024.

Salary histogram for Actionable Insight in the UK

Actionable Insight
Top 17 Job Locations

The table below looks at the demand and provides a guide to the median salaries quoted in IT jobs citing Actionable Insight within the UK over the 6 months to 27 April 2024. The 'Rank Change' column provides an indication of the change in demand within each location based on the same 6 month period last year.

Location Rank Change
on Same Period
Last Year
Matching
Permanent
IT Job Ads
Median Salary
Past 6 Months
Median Salary
% Change
on Same Period
Last Year
Live
Jobs
UK excluding London +6 3,314 £50,000 -3.85% 198
England +48 3,196 £55,000 - 411
Work from Home +33 2,326 £51,250 -6.93% 200
London +196 828 £60,000 +4.35% 230
South East +41 778 £45,000 -10.00% 35
North of England +26 680 £57,500 +10.58% 60
South West -10 528 £59,556 +8.52% 24
Scotland -29 492 £51,500 +7.95% 16
North West +16 454 £59,556 -11.77% 37
Midlands -17 318 £57,500 +27.78% 33
Wales +1 290 £42,500 - 8
Yorkshire +21 219 £54,000 +13.68% 15
East Midlands -16 214 £35,000 -7.89% 14
Northern Ireland +12 190 £35,000 - 5
West Midlands +4 104 £57,500 +17.95% 19
East of England -24 42 £43,000 - 25
North East -16 7 £44,225 +4.06% 8

Actionable Insight
Co-occurring Skills and Capabilities by Category

The follow tables expand on the table above by listing co-occurrences grouped by category. The same employment type, locality and period is covered with up to 20 co-occurrences shown in each of the following categories:

Application Platforms
1 330 (7.57%) ArcGIS
1 330 (7.57%) GeoServer
2 119 (2.73%) WebLogic
3 81 (1.86%) Apache
4 63 (1.45%) Confluence
5 46 (1.06%) SAS
6 44 (1.01%) Oracle Service Bus
7 35 (0.80%) Apache Spark
8 28 (0.64%) JBoss
8 28 (0.64%) Red Hat Fuse
9 14 (0.32%) Skype for Business
10 12 (0.28%) Anypoint
10 12 (0.28%) SharePoint
11 6 (0.14%) OpenStack
12 4 (0.092%) Jupyter
12 4 (0.092%) TWiki
13 2 (0.046%) MS Project Server
14 1 (0.023%) Apache Airflow
14 1 (0.023%) WordPress
Applications
1 668 (15.32%) Microsoft Excel
2 80 (1.84%) Microsoft Office
3 78 (1.79%) MS Visio
4 53 (1.22%) Sketch
5 37 (0.85%) Microsoft PowerPoint
6 32 (0.73%) UserZoom
7 7 (0.16%) Oracle Smart View
7 7 (0.16%) SPSS
8 6 (0.14%) InVision
9 4 (0.092%) Microsoft Project
10 2 (0.046%) EViews
11 1 (0.023%) Adobe Captivate
11 1 (0.023%) Spreadsheet
Business Applications
1 76 (1.74%) Remedy ITSM
2 58 (1.33%) Sparx Enterprise Architect
3 37 (0.85%) Siebel CRM
4 8 (0.18%) Dynamics CRM
5 7 (0.16%) HFM
5 7 (0.16%) Hyperion Planning
6 5 (0.11%) Shopify
7 4 (0.092%) BASE24
8 2 (0.046%) Primavera
9 1 (0.023%) Magento
9 1 (0.023%) NetSuite
9 1 (0.023%) SAP S/4HANA
Cloud Services
1 1,005 (23.06%) AWS
2 907 (20.81%) Azure
3 238 (5.46%) Power Platform
4 190 (4.36%) SaaS
5 149 (3.42%) GCP
6 111 (2.55%) Figma
7 95 (2.18%) Serverless
8 91 (2.09%) Microsoft 365
9 73 (1.67%) Amazon EKS
10 72 (1.65%) Miro
11 65 (1.49%) Amazon S3
12 64 (1.47%) OpenShift
12 64 (1.47%) SurveyMonkey
13 57 (1.31%) PowerApps
14 56 (1.28%) Power Automate
15 50 (1.15%) Amazon SQS
16 46 (1.06%) Heroku
17 42 (0.96%) Azure DevOps
18 41 (0.94%) AWS CloudFormation
19 34 (0.78%) Cloud Computing
Communications & Networking
1 453 (10.39%) Broadband
2 375 (8.60%) VSAT
3 192 (4.40%) Firewall
4 112 (2.57%) TCP/IP
4 112 (2.57%) VPN
5 109 (2.50%) DNS
6 95 (2.18%) Internet
7 58 (1.33%) WAN
8 56 (1.28%) IPsec
9 54 (1.24%) SNMP
10 52 (1.19%) LAN
11 46 (1.06%) BGP
11 46 (1.06%) DHCP
11 46 (1.06%) SSL
12 41 (0.94%) HTTP
13 29 (0.67%) Network Security
14 23 (0.53%) AMQP
15 21 (0.48%) Wireless
16 17 (0.39%) Cisco ASA
17 16 (0.37%) 5G
Database & Business Intelligence
1 439 (10.07%) PostgreSQL
2 354 (8.12%) GIS
3 330 (7.57%) QGIS
4 238 (5.46%) Tableau
5 236 (5.41%) Power BI
6 235 (5.39%) Oracle Database
7 150 (3.44%) Oracle Database 11g
8 118 (2.71%) Data Warehouse
9 112 (2.57%) Relational Database
10 101 (2.32%) RDBMS
11 90 (2.06%) MongoDB
12 89 (2.04%) Elasticsearch
13 76 (1.74%) SQL Server
14 51 (1.17%) Big Data
15 47 (1.08%) Amazon RDS
16 44 (1.01%) Oracle Database 10g
16 44 (1.01%) VLDB
17 39 (0.89%) Data Lake
18 35 (0.80%) Geospatial Data
19 32 (0.73%) Hadoop
Development Applications
1 248 (5.69%) Git
2 174 (3.99%) JIRA
3 121 (2.78%) Jenkins
4 36 (0.83%) JDeveloper
5 28 (0.64%) IntelliJ
6 26 (0.60%) GitLab
7 25 (0.57%) Selenium
8 24 (0.55%) Ant
9 18 (0.41%) Subversion
10 16 (0.37%) Robot Framework
11 13 (0.30%) SonarQube
12 12 (0.28%) SQL Server Management Studio (SSMS)
13 10 (0.23%) TestRail
13 10 (0.23%) Trac
14 7 (0.16%) Visual Studio
15 4 (0.092%) eggPlant
16 3 (0.069%) ER Studio
16 3 (0.069%) ERwin
17 2 (0.046%) TeamCity
18 1 (0.023%) Axure RP
General
1 1,554 (35.65%) Social Skills
2 993 (22.78%) Finance
3 890 (20.42%) Analytical Skills
4 480 (11.01%) Influencing Skills
5 279 (6.40%) Aerospace
6 269 (6.17%) Presentation Skills
7 228 (5.23%) Marketing
8 174 (3.99%) Retail
9 147 (3.37%) Public Sector
10 107 (2.45%) Law
11 99 (2.27%) Inclusion and Diversity
12 76 (1.74%) Games
13 59 (1.35%) Banking
14 49 (1.12%) Telecoms
15 40 (0.92%) Police
16 36 (0.83%) Local Government
17 34 (0.78%) Social Science
18 33 (0.76%) Organisational Skills
19 29 (0.67%) Manufacturing
20 27 (0.62%) Legal
Job Titles
1 1,248 (28.63%) Senior
2 990 (22.71%) Analyst
3 928 (21.29%) Architect
4 545 (12.50%) Software Engineer
5 415 (9.52%) Senior Analyst
6 386 (8.86%) Software Architect
7 330 (7.57%) Developer
8 276 (6.33%) Lead
9 264 (6.06%) Solutions Architect
10 262 (6.01%) Senior Software Engineer
11 237 (5.44%) Project Manager
12 215 (4.93%) Senior Developer
13 189 (4.34%) Consultant
14 183 (4.20%) Presales Manager
15 182 (4.18%) Data Analyst
16 131 (3.01%) Financial Analyst
17 127 (2.91%) Commercial Analyst
18 105 (2.41%) Database Developer
18 105 (2.41%) PostgreSQL Developer
19 103 (2.36%) Support Analyst
Libraries, Frameworks & Software Standards
1 440 (10.09%) React
2 347 (7.96%) .NET
3 331 (7.59%) Leaflet
3 331 (7.59%) OpenLayers
4 330 (7.57%) PostGIS
5 317 (7.27%) CSS
6 305 (7.00%) .NET Core
7 146 (3.35%) AngularJS
8 141 (3.23%) Spring
9 123 (2.82%) RabbitMQ
10 117 (2.68%) Node.js
11 101 (2.32%) HTML
12 69 (1.58%) Spring Boot
13 61 (1.40%) Hibernate
14 59 (1.35%) Java EE
14 59 (1.35%) REST
15 58 (1.33%) RESTful
16 56 (1.28%) Web Services
17 54 (1.24%) YAML
18 50 (1.15%) J2EE
Miscellaneous
1 139 (3.19%) Public Cloud
2 104 (2.39%) Management Information System
3 99 (2.27%) Data Centre
4 96 (2.20%) PKI
5 95 (2.18%) Self-Motivation
6 83 (1.90%) Algorithms
7 78 (1.79%) Product Ownership
8 77 (1.77%) Enterprise Software
9 71 (1.63%) Cloud Native
10 54 (1.24%) Virtual Team
11 36 (0.83%) Onboarding
12 33 (0.76%) Legacy Systems
13 28 (0.64%) Data Structures
14 27 (0.62%) Market Risk
15 22 (0.50%) CMDB
15 22 (0.50%) Hybrid Cloud
15 22 (0.50%) Security Operations Centre
16 21 (0.48%) Satnav
17 18 (0.41%) NHS
18 17 (0.39%) Cyber Threat
Operating Systems
1 510 (11.70%) Linux
2 273 (6.26%) Windows
3 125 (2.87%) Unix
4 115 (2.64%) Red Hat Enterprise Linux
5 106 (2.43%) Ubuntu
6 58 (1.33%) CentOS
7 54 (1.24%) Data ONTAP
8 52 (1.19%) Solaris
9 49 (1.12%) VMS
10 32 (0.73%) Windows Server 2019
11 30 (0.69%) Windows Server 2012
11 30 (0.69%) Windows Server 2016
12 26 (0.60%) Windows Server
13 24 (0.55%) Debian
14 14 (0.32%) Mac OS X
15 8 (0.18%) AIX
16 4 (0.092%) Windows Server 2008
16 4 (0.092%) Windows Vista
Processes & Methodologies
1 2,002 (45.93%) Agile
2 916 (21.01%) Problem-Solving
3 848 (19.45%) Decision-Making
4 782 (17.94%) DevOps
5 717 (16.45%) Mentoring
6 675 (15.49%) Business Case
7 661 (15.16%) Project Management
8 612 (14.04%) Software Engineering
9 607 (13.93%) TOGAF
10 553 (12.69%) Analytics
11 517 (11.86%) Validation
12 507 (11.63%) Presales
13 468 (10.74%) Budgeting and Forecasting
14 454 (10.42%) Budgeting
15 450 (10.32%) Collaborative Working
16 426 (9.77%) Model Validation
17 408 (9.36%) Technical Architecture
18 406 (9.31%) Visualisation
19 401 (9.20%) Requirements Management
20 393 (9.02%) Network Management
Programming Languages
1 855 (19.61%) Python
2 646 (14.82%) SQL
3 467 (10.71%) JavaScript
4 281 (6.45%) Java
5 273 (6.26%) C#
6 156 (3.58%) PL/SQL
7 128 (2.94%) Bash
8 123 (2.82%) PowerShell
9 71 (1.63%) R
10 57 (1.31%) C++
10 57 (1.31%) Ruby
11 42 (0.96%) Go
12 40 (0.92%) Data Analysis Expressions
13 36 (0.83%) Perl
14 30 (0.69%) Shell Script
15 28 (0.64%) C
15 28 (0.64%) T-SQL
16 25 (0.57%) MATLAB
17 16 (0.37%) Bicep
18 15 (0.34%) TypeScript
Qualifications
1 1,800 (41.29%) Security Cleared
2 1,391 (31.91%) SC Cleared
3 600 (13.76%) Degree
4 456 (10.46%) ACCA
4 456 (10.46%) CIMA
5 296 (6.79%) DV Cleared
6 139 (3.19%) DBS Check
7 119 (2.73%) Master's Degree
8 75 (1.72%) AWS Certification
9 70 (1.61%) Azure Certification
10 52 (1.19%) AWS Certified Solutions Architect
11 49 (1.12%) PhD
12 46 (1.06%) PRINCE2 Practitioner
13 43 (0.99%) TOGAF Certification
14 32 (0.73%) Computer Science Degree
15 18 (0.41%) CISSP
16 17 (0.39%) Cisco Certification
17 15 (0.34%) CISM
17 15 (0.34%) GCIA
17 15 (0.34%) GCIH
Quality Assurance & Compliance
1 158 (3.62%) Accessibility
2 140 (3.21%) Actionable Recommendations
3 128 (2.94%) QA
4 74 (1.70%) SLA
5 63 (1.45%) PMO
6 59 (1.35%) WCAG
7 58 (1.33%) Data Quality
8 32 (0.73%) COBIT
9 21 (0.48%) Software Quality Assurance
10 17 (0.39%) NIST
11 14 (0.32%) ISO/IEC 27001
12 12 (0.28%) GDPR
13 8 (0.18%) PCI DSS
14 6 (0.14%) GRC
14 6 (0.14%) IFRS
15 4 (0.092%) ISO 9001
16 3 (0.069%) HAZOP
17 1 (0.023%) California Consumer Privacy Act
17 1 (0.023%) Cyber Essentials
System Software
1 189 (4.34%) Docker
2 121 (2.78%) VMware Infrastructure
3 66 (1.51%) Active Directory
4 52 (1.19%) Hyper-V
5 44 (1.01%) Oracle RAC
5 44 (1.01%) Virtual Machines
6 16 (0.37%) pfSense
7 14 (0.32%) VMware NSX
8 10 (0.23%) NFS
9 8 (0.18%) Firmware
9 8 (0.18%) VMware ESXi
9 8 (0.18%) vSphere
10 3 (0.069%) KVM
11 2 (0.046%) HDFS
Systems Management
1 279 (6.40%) Ansible
2 200 (4.59%) Kubernetes
3 124 (2.84%) Terraform
4 66 (1.51%) Prometheus
5 59 (1.35%) Puppet
6 54 (1.24%) vCenter Server
7 44 (1.01%) Data Guard
7 44 (1.01%) Oracle RMAN
8 32 (0.73%) OpenView
9 29 (0.67%) OpenSSO
9 29 (0.67%) Single Sign-On
10 28 (0.64%) Grafana
11 16 (0.37%) ZABBIX
12 14 (0.32%) SCCM
13 12 (0.28%) WSUS
14 10 (0.23%) Microsoft Data Protection Manager
14 10 (0.23%) SCDPM
15 5 (0.11%) FortiGate
16 1 (0.023%) HP Fortify
16 1 (0.023%) Kustomize
Vendors
1 767 (17.60%) Microsoft
2 413 (9.47%) Oracle
3 333 (7.64%) ESRI
4 163 (3.74%) VMware
5 157 (3.60%) Google
6 155 (3.56%) Red Hat
7 132 (3.03%) Databricks
8 105 (2.41%) Remedy
9 67 (1.54%) Palo Alto
10 64 (1.47%) Qualtrics
11 63 (1.45%) ServiceNow
12 58 (1.33%) Sparx
13 54 (1.24%) NetApp
13 54 (1.24%) SolidFire
14 44 (1.01%) Sun
15 43 (0.99%) Cisco
16 37 (0.85%) HP
16 37 (0.85%) Siebel
17 32 (0.73%) BMC
17 32 (0.73%) Salesforce