Analyst
UK

The median Analyst salary in the UK is £47,500 per year, according to job vacancies posted during the 6 months leading to 8 May 2025.

The table below provides salary benchmarking and summary statistics, comparing them to the same period in the previous two years.

6 months to
8 May 2025
Same period 2024 Same period 2023
Rank 17 13 16
Rank change year-on-year -4 +3 +6
Permanent jobs requiring an Analyst 4,679 9,790 12,066
As % of all permanent jobs advertised in the UK 8.66% 9.90% 11.75%
As % of the Job Titles category 9.58% 10.46% 12.84%
Number of salaries quoted 2,773 6,661 7,641
10th Percentile £26,250 £25,750 £26,750
25th Percentile £35,000 £31,250 £34,000
Median annual salary (50th Percentile) £47,500 £45,000 £46,000
Median % change year-on-year +5.56% -2.17% +2.22%
75th Percentile £65,000 £57,500 £61,250
90th Percentile £80,000 £75,000 £72,500
UK excluding London median annual salary £42,500 £40,000 £40,000
% change year-on-year +6.25% - -

All Permanent IT Job Vacancies
UK

For comparison with the information above, the following table provides summary statistics for all permanent IT job vacancies. Most job vacancies include a discernible job title that can be normalized. As such, the figures in the second row provide an indication of the number of permanent jobs in our overall sample.

Permanent vacancies in the UK with a recognized job title 48,816 93,552 93,960
% of permanent jobs with a recognized job title 90.39% 94.64% 91.50%
Number of salaries quoted 27,241 67,063 59,087
10th Percentile £30,000 £28,500 £32,500
25th Percentile £41,500 £38,500 £45,000
Median annual salary (50th Percentile) £57,500 £52,501 £60,000
Median % change year-on-year +9.52% -12.50% -
75th Percentile £75,000 £71,250 £81,250
90th Percentile £97,500 £90,000 £100,000
UK excluding London median annual salary £52,000 £50,000 £53,000
% change year-on-year +4.00% -5.66% +6.00%

Analyst
Job Vacancy Trend

Job postings that featured Analyst in the job title as a proportion of all IT jobs advertised.
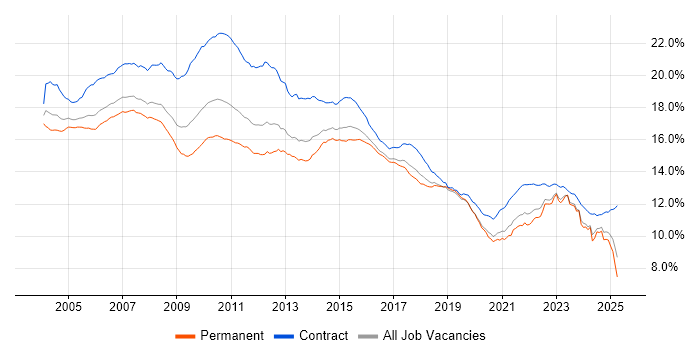
Job vacancy trend for Analyst in the UK

Analyst
Salary Trend

3-month moving average salary quoted in jobs citing Analyst.

Salary trend for Analyst in the UK

Analyst
Salary Histogram

Salary distribution for jobs citing Analyst over the 6 months to 8 May 2025.

Salary histogram for Analyst in the UK

Analyst
Top 18 Job Locations

The table below looks at the demand and provides a guide to the median salaries quoted in IT jobs citing Analyst within the UK over the 6 months to 8 May 2025. The 'Rank Change' column provides an indication of the change in demand within each location based on the same 6 month period last year.

Location Rank Change
on Same Period
Last Year
Matching
Permanent
IT Job Ads
Median Salary
Past 6 Months
Median Salary
% Change
on Same Period
Last Year
Live
Jobs
England -4 4,306 £47,500 +5.56% 3,194
UK excluding London -14 2,700 £42,500 +6.25% 1,920
London +1 1,833 £63,200 +5.47% 1,842
Work from Home -11 1,344 £50,000 +10.50% 1,914
North of England -18 777 £40,000 +0.92% 411
Midlands -10 570 £42,500 +13.33% 286
South East -24 516 £45,000 +12.50% 746
North West -25 514 £41,000 +2.50% 241
West Midlands -14 338 £45,000 +20.00% 179
East of England -13 317 £47,500 +21.22% 166
South West -6 233 £40,000 -5.88% 155
Scotland +27 232 £45,000 +5.88% 133
East Midlands -4 231 £38,500 +5.48% 93
Yorkshire -10 220 £30,500 -20.78% 132
North East -15 43 £38,500 +10.00% 41
Northern Ireland +29 31 £30,000 -40.00% 40
Wales -43 19 £50,000 +37.08% 27
Isle of Man +1 7 £38,000 -18.28% 2

Analyst Skill Set
Top 30 Co-occurring Skills and Capabilities

For the 6 months to 8 May 2025, Analyst job roles required the following skills and capabilities in order of popularity. The figures indicate the absolute number co-occurrences and as a proportion of all permanent job ads featuring Analyst in the job title.

1 2,192 (46.85%) Social Skills
2 1,819 (38.88%) Finance
3 1,456 (31.12%) Analytical Skills
4 1,405 (30.03%) Degree
5 1,069 (22.85%) Problem-Solving
6 1,021 (21.82%) SQL
7 992 (21.20%) Microsoft
8 769 (16.44%) Decision-Making
9 758 (16.20%) Banking
10 705 (15.07%) Agile
11 696 (14.87%) Risk Management
12 680 (14.53%) Windows
13 664 (14.19%) Analytics
14 623 (13.31%) Inclusion and Diversity
15 597 (12.76%) Business Intelligence
16 596 (12.74%) Asset Management
17 587 (12.55%) Microsoft 365
18 585 (12.50%) Azure
19 560 (11.97%) Power Platform
20 537 (11.48%) Master's Degree
21 533 (11.39%) Microsoft PowerPoint
22 518 (11.07%) Fixed Income
22 518 (11.07%) Power BI
23 503 (10.75%) Portfolio Management
24 495 (10.58%) Python
25 494 (10.56%) Microsoft Excel
26 490 (10.47%) Business Strategy
27 473 (10.11%) Risk Assessment
28 465 (9.94%) Customer Service
29 463 (9.90%) Data Analysis

Analyst Skill Set
Co-occurring Skills and Capabilities by Category

The follow tables expand on the table above by listing co-occurrences grouped by category. The same employment type, locality and period is covered with up to 20 co-occurrences shown in each of the following categories:

Application Platforms
1 223 (4.77%) SharePoint
2 153 (3.27%) Microsoft Exchange
3 113 (2.42%) Confluence
4 46 (0.98%) SAS
5 36 (0.77%) IBM Domino
6 32 (0.68%) IIS
7 14 (0.30%) Apache Spark
8 9 (0.19%) Apache
9 8 (0.17%) Jupyter
10 4 (0.085%) Alfresco
10 4 (0.085%) Apache Airflow
10 4 (0.085%) Cloud Foundry
10 4 (0.085%) Documentum
10 4 (0.085%) Mule
10 4 (0.085%) Tomcat
11 3 (0.064%) Skype for Business
12 2 (0.043%) Exchange Server 2013
13 1 (0.021%) Exchange Server 2010
13 1 (0.021%) Oracle SOA Suite
13 1 (0.021%) Totara
Applications
1 533 (11.39%) Microsoft PowerPoint
2 494 (10.56%) Microsoft Excel
3 348 (7.44%) Microsoft Office
4 68 (1.45%) MS Visio
5 20 (0.43%) Chatbot
6 16 (0.34%) Spreadsheet
6 16 (0.34%) SPSS
7 14 (0.30%) Microsoft Project
8 5 (0.11%) Trello
9 3 (0.064%) Adobe Creative Suite
10 2 (0.043%) Acrobat
10 2 (0.043%) Adobe XD
11 1 (0.021%) Notion
11 1 (0.021%) Simulink
11 1 (0.021%) Sketch
Business Applications
1 57 (1.22%) Aladdin
2 42 (0.90%) SAP S/4HANA
3 34 (0.73%) thinkFolio
4 26 (0.56%) Dynamics AX
5 19 (0.41%) NetSuite
5 19 (0.41%) SAP FI
6 17 (0.36%) SAP HCM
7 16 (0.34%) Dynamics CRM
7 16 (0.34%) OpenText VIM for SAP
8 15 (0.32%) Oracle EBS
9 14 (0.30%) Salesforce CRM
9 14 (0.30%) SAP Payroll
10 13 (0.28%) SAP HR
11 12 (0.26%) Dynamics NAV
12 10 (0.21%) Fidessa
12 10 (0.21%) Infor M3
12 10 (0.21%) Remedy ITSM
13 8 (0.17%) iTrent
13 8 (0.17%) Oracle Applications
13 8 (0.17%) SAP ERP
Cloud Services
1 587 (12.55%) Microsoft 365
2 585 (12.50%) Azure
3 560 (11.97%) Power Platform
4 159 (3.40%) AWS
5 128 (2.74%) Entra ID
6 103 (2.20%) SaaS
7 95 (2.03%) Dynamics 365
8 59 (1.26%) Azure Sentinel
9 57 (1.22%) OneDrive
10 43 (0.92%) Google Analytics
11 39 (0.83%) GCP
12 34 (0.73%) Azure DevOps
13 32 (0.68%) Snowflake
14 29 (0.62%) Azure Logic Apps
14 29 (0.62%) Power Automate
15 26 (0.56%) Azure Data Factory
16 24 (0.51%) Cloud Computing
16 24 (0.51%) Mimecast
16 24 (0.51%) PowerApps
17 19 (0.41%) SuccessFactors
Communications & Networking
1 248 (5.30%) Firewall
2 131 (2.80%) DNS
3 101 (2.16%) DHCP
4 93 (1.99%) VPN
5 89 (1.90%) TCP/IP
6 84 (1.80%) VoIP
7 64 (1.37%) LAN
8 63 (1.35%) WAN
9 52 (1.11%) Network Security
10 43 (0.92%) VLAN
11 37 (0.79%) Wireless
12 35 (0.75%) Wi-Fi
13 32 (0.68%) Internet
14 27 (0.58%) Cisco IOS
15 24 (0.51%) Intrusion Detection
16 21 (0.45%) SAN
17 19 (0.41%) Remote Desktop
17 19 (0.41%) SSL
18 14 (0.30%) FTP
19 11 (0.24%) WebEx
Database & Business Intelligence
1 518 (11.07%) Power BI
2 220 (4.70%) Tableau
3 166 (3.55%) SQL Server
4 98 (2.09%) Data Warehouse
5 82 (1.75%) SQL Server Reporting Services
6 70 (1.50%) SQL Server Integration Services
7 64 (1.37%) Relational Database
8 60 (1.28%) Big Data
9 37 (0.79%) Data Lake
10 30 (0.64%) Data Mining
11 28 (0.60%) DB2
12 26 (0.56%) Looker
12 26 (0.56%) Power Query
13 25 (0.53%) MySQL
14 18 (0.38%) Amazon RDS
14 18 (0.38%) BusinessObjects
15 15 (0.32%) Oracle Reports
16 14 (0.30%) RDBMS
17 12 (0.26%) Azure SQL Database
17 12 (0.26%) BigQuery
Development Applications
1 222 (4.74%) JIRA
2 48 (1.03%) Git
3 29 (0.62%) Selenium
4 21 (0.45%) eggPlant
5 19 (0.41%) Postman
6 17 (0.36%) Visual Studio
7 16 (0.34%) SQL Server Management Studio (SSMS)
8 13 (0.28%) Burp Suite
8 13 (0.28%) Cypress.io
8 13 (0.28%) JMeter
9 9 (0.19%) Appium
10 8 (0.17%) Eclipse
10 8 (0.17%) TestNG
11 7 (0.15%) Cucumber
11 7 (0.15%) Jenkins
12 6 (0.13%) JUnit
13 5 (0.11%) Gatling
13 5 (0.11%) TestRail
14 4 (0.085%) REST Assured
14 4 (0.085%) TestCafe
General
1 2,192 (46.85%) Social Skills
2 1,819 (38.88%) Finance
3 1,456 (31.12%) Analytical Skills
4 758 (16.20%) Banking
5 623 (13.31%) Inclusion and Diversity
6 459 (9.81%) Financial Institution
7 426 (9.10%) German Language
8 415 (8.87%) French Language
9 327 (6.99%) Law
10 216 (4.62%) Legal
11 212 (4.53%) Organisational Skills
12 197 (4.21%) Retail
13 155 (3.31%) Influencing Skills
14 153 (3.27%) Marketing
15 134 (2.86%) Presentation Skills
16 125 (2.67%) Front Office
17 106 (2.27%) Telecoms
18 92 (1.97%) Manufacturing
19 79 (1.69%) Public Sector
20 57 (1.22%) Documentation Skills
Libraries, Frameworks & Software Standards
1 56 (1.20%) .NET
2 43 (0.92%) JSON
3 42 (0.90%) HTML
4 41 (0.88%) XML
5 35 (0.75%) Web Services
6 33 (0.71%) REST
7 28 (0.60%) SOAP
8 19 (0.41%) FIX Protocol
8 19 (0.41%) Middleware
9 18 (0.38%) Oracle Fusion
9 18 (0.38%) Pandas
10 15 (0.32%) ASP.NET
11 14 (0.30%) EDI
12 13 (0.28%) CSS
13 12 (0.26%) .NET Framework
13 12 (0.26%) SAP Fiori
14 11 (0.24%) PySpark
15 10 (0.21%) Gherkin
16 9 (0.19%) RESTful
17 7 (0.15%) React
Miscellaneous
1 518 (11.07%) Fixed Income
2 442 (9.45%) Credit Risk
3 229 (4.89%) Management Information System
4 143 (3.06%) Onboarding
5 135 (2.89%) Product Ownership
6 125 (2.67%) Hedge funds
7 115 (2.46%) Derivative
8 107 (2.29%) Analytical Mindset
9 98 (2.09%) Self-Motivation
10 67 (1.43%) Cyber Threat
11 64 (1.37%) Security Posture
12 53 (1.13%) Video Conferencing
13 51 (1.09%) Equities
14 47 (1.00%) Driving Licence
15 43 (0.92%) Foreign Exchange (FX)
16 37 (0.79%) Legacy Systems
17 36 (0.77%) Mobile App
17 36 (0.77%) Security Operations Centre
18 35 (0.75%) Data Centre
19 32 (0.68%) Social Media
Operating Systems
1 680 (14.53%) Windows
2 183 (3.91%) Windows 10
3 172 (3.68%) Windows Server
4 167 (3.57%) Linux
5 69 (1.47%) Apple iOS
6 54 (1.15%) Unix
7 49 (1.05%) Mac OS
8 42 (0.90%) Windows Server 2019
9 30 (0.64%) Android
10 27 (0.58%) Mac OS X
10 27 (0.58%) Windows Server 2016
11 24 (0.51%) Windows Server 2012
12 20 (0.43%) Windows Vista
13 12 (0.26%) Red Hat Enterprise Linux
13 12 (0.26%) zOS
14 10 (0.21%) CentOS
15 9 (0.19%) Solaris
15 9 (0.19%) Windows 7
16 8 (0.17%) Rocky
17 6 (0.13%) Windows 8
Processes & Methodologies
1 1,069 (22.85%) Problem-Solving
2 769 (16.44%) Decision-Making
3 705 (15.07%) Agile
4 696 (14.87%) Risk Management
5 664 (14.19%) Analytics
6 597 (12.76%) Business Intelligence
7 596 (12.74%) Asset Management
8 503 (10.75%) Portfolio Management
9 490 (10.47%) Business Strategy
10 473 (10.11%) Risk Assessment
11 465 (9.94%) Customer Service
12 463 (9.90%) Data Analysis
13 462 (9.87%) Financial Modelling
14 449 (9.60%) ITIL
15 441 (9.43%) Business Analysis
16 428 (9.15%) Cybersecurity
17 415 (8.87%) Credit Risk Analysis
18 391 (8.36%) Stakeholder Management
19 388 (8.29%) Continuous Improvement
20 354 (7.57%) Project Management
Programming Languages
1 1,021 (21.82%) SQL
2 495 (10.58%) Python
3 137 (2.93%) PowerShell
4 94 (2.01%) C#
5 77 (1.65%) JavaScript
6 71 (1.52%) R
6 71 (1.52%) T-SQL
7 49 (1.05%) Java
8 44 (0.94%) PL/SQL
9 40 (0.85%) Data Analysis Expressions
10 34 (0.73%) Bash
10 34 (0.73%) Kusto Query Language
11 32 (0.68%) C++
12 27 (0.58%) VB.NET
13 25 (0.53%) VBA
14 13 (0.28%) ABAP
14 13 (0.28%) Perl
15 12 (0.26%) TypeScript
16 11 (0.24%) Shell Script
17 9 (0.19%) Korn
Qualifications
1 1,405 (30.03%) Degree
2 537 (11.48%) Master's Degree
3 418 (8.93%) CFA
4 183 (3.91%) CISSP
5 150 (3.21%) BPSS Clearance
6 137 (2.93%) CISM
7 136 (2.91%) Security Cleared
8 134 (2.86%) DBS Check
9 130 (2.78%) CBAP
10 91 (1.94%) Microsoft Certification
11 87 (1.86%) CESG Certified Professional
12 83 (1.77%) SC Cleared
13 77 (1.65%) Computer Science Degree
14 69 (1.47%) ACCA
15 68 (1.45%) CompTIA Security+
16 66 (1.41%) CIMA
17 64 (1.37%) A+ Certification
18 50 (1.07%) ISTQB
19 49 (1.05%) PhD
20 45 (0.96%) CEH
Quality Assurance & Compliance
1 206 (4.40%) ISO/IEC 27001
2 186 (3.98%) Data Quality
3 183 (3.91%) NIST
4 163 (3.48%) QA
5 140 (2.99%) SLA
6 87 (1.86%) JSP 440
6 87 (1.86%) RMADS
7 71 (1.52%) GDPR
8 54 (1.15%) PMO
9 50 (1.07%) Accessibility
10 46 (0.98%) Sarbanes-Oxley
11 42 (0.90%) GRC
12 39 (0.83%) PCI DSS
13 30 (0.64%) MiFID
14 28 (0.60%) Cyber Essentials
15 22 (0.47%) EMIR
16 20 (0.43%) Actionable Recommendations
17 15 (0.32%) NCSC
18 13 (0.28%) Cyber Essentials PLUS
19 8 (0.17%) SOC 2
System Software
1 436 (9.32%) Active Directory
2 51 (1.09%) VMware Infrastructure
3 26 (0.56%) Virtual Desktop
4 21 (0.45%) Hyper-V
5 19 (0.41%) Virtual Machines
6 17 (0.36%) Docker
7 16 (0.34%) Firmware
8 8 (0.17%) XenApp
9 7 (0.15%) Virtual Servers
10 5 (0.11%) DFS Replication
11 4 (0.085%) BitLocker
11 4 (0.085%) Microsoft Virtual Server
12 2 (0.043%) VMware ESXi
12 2 (0.043%) XenDesktop
13 1 (0.021%) Embedded Firmware
13 1 (0.021%) Microsoft App-V
13 1 (0.021%) RACF
13 1 (0.021%) Snort
Systems Management
1 152 (3.25%) Microsoft Intune
2 59 (1.26%) SCCM
3 15 (0.32%) Grafana
4 10 (0.21%) QRadar
5 8 (0.17%) Active Directory Federation Services
5 8 (0.17%) CSIRT
5 8 (0.17%) Single Sign-On
5 8 (0.17%) Terraform
6 7 (0.15%) Ansible
6 7 (0.15%) Kubernetes
7 6 (0.13%) WSUS
7 6 (0.13%) ZABBIX
8 5 (0.11%) Graylog
8 5 (0.11%) Nessus
8 5 (0.11%) Prometheus
9 4 (0.085%) CASB
9 4 (0.085%) Puppet
10 3 (0.064%) Jamf Pro
10 3 (0.064%) Nagios
10 3 (0.064%) NetBackup
Vendors
1 992 (21.20%) Microsoft
2 442 (9.45%) Bloomberg
3 195 (4.17%) SAP
4 158 (3.38%) ServiceNow
5 119 (2.54%) Oracle
6 116 (2.48%) VMware
7 78 (1.67%) Salesforce
8 77 (1.65%) Google
9 70 (1.50%) Cisco
10 68 (1.45%) Databricks
11 67 (1.43%) Alteryx
12 53 (1.13%) BISAM
13 51 (1.09%) Citrix
14 40 (0.85%) Charles River
15 35 (0.75%) Apple
16 32 (0.68%) Calypso
16 32 (0.68%) SimCorp
17 31 (0.66%) Adobe
17 31 (0.66%) Splunk
18 27 (0.58%) iManage