BPSS Clearance Jobs

Baseline Personnel Security Standard (BPSS) Clearance
UK

The table below provides summary statistics for permanent job vacancies with a requirement for BPSS Clearance qualifications. It includes a benchmarking guide to the salaries offered over the 6 months leading up to 8 May 2025, comparing them to the same period in the previous two years.

6 months to
8 May 2025
Same period 2024 Same period 2023
Rank 7 329 566
Rank change year-on-year +322 +237 +307
Permanent jobs citing BPSS Clearance 7,918 857 460
As % of all permanent jobs advertised in the UK 14.66% 0.87% 0.45%
As % of the Qualifications category 29.62% 3.13% 1.37%
Number of salaries quoted 3,336 678 254
10th Percentile £37,574 £25,750 £30,000
25th Percentile £47,683 £32,500 £40,000
Median annual salary (50th Percentile) £50,600 £55,000 £57,500
Median % change year-on-year -8.00% -4.35% +9.52%
75th Percentile £61,967 £65,000 £77,500
90th Percentile £70,600 £77,500 £90,000
UK excluding London median annual salary £50,818 £52,000 £52,250
% change year-on-year -2.27% -0.48% +10.00%

All Academic and Professional Certifications
UK

BPSS Clearance falls under the Academic Qualifications and Professional Certifications category. For comparison with the information above, the following table provides summary statistics for all permanent job vacancies requiring academic qualifications or professional certifications.

Permanent vacancies requiring academic qualifications or professional certifications 26,736 27,390 33,556
As % of all permanent jobs advertised in the UK 49.51% 27.71% 32.68%
Number of salaries quoted 11,332 17,289 15,057
10th Percentile £32,500 £28,385 £31,250
25th Percentile £44,000 £38,500 £41,750
Median annual salary (50th Percentile) £55,000 £54,000 £59,000
Median % change year-on-year +1.85% -8.47% +7.27%
75th Percentile £68,568 £71,000 £77,500
90th Percentile £83,750 £87,500 £95,000
UK excluding London median annual salary £52,000 £50,000 £51,276
% change year-on-year +4.00% -2.49% +2.55%

BPSS Clearance
Job Vacancy Trend

Job postings citing BPSS Clearance as a proportion of all IT jobs advertised.
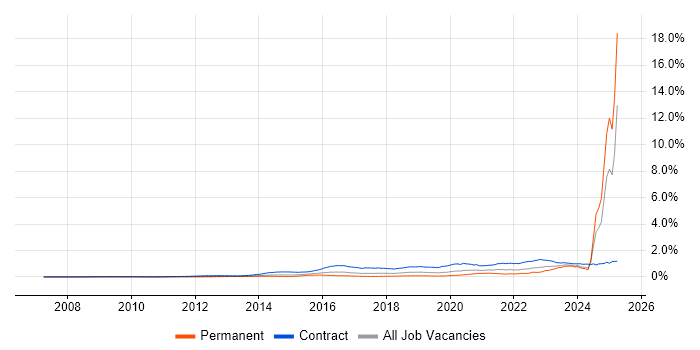
Job vacancy trend for BPSS Clearance in the UK

BPSS Clearance
Salary Trend

3-month moving average salary quoted in jobs citing BPSS Clearance.

Salary trend for BPSS Clearance in the UK

BPSS Clearance
Salary Histogram

Salary distribution for jobs citing BPSS Clearance over the 6 months to 8 May 2025.

Salary histogram for BPSS Clearance in the UK

BPSS Clearance
Top 15 Job Locations

The table below looks at the demand and provides a guide to the median salaries quoted in IT jobs citing BPSS Clearance within the UK over the 6 months to 8 May 2025. The 'Rank Change' column provides an indication of the change in demand within each location based on the same 6 month period last year.

Location Rank Change
on Same Period
Last Year
Matching
Permanent
IT Job Ads
Median Salary
Past 6 Months
Median Salary
% Change
on Same Period
Last Year
Live
Jobs
UK excluding London +285 7,759 £50,818 -2.27% 465
England +310 7,003 £50,055 -8.99% 529
North of England +355 3,057 £50,055 +2.15% 168
North West +256 2,833 £50,055 +78.77% 147
Midlands +263 1,801 £47,683 +19.21% 56
South East +320 1,363 £62,000 +18.56% 131
West Midlands +229 1,060 £65,500 +9.17% 39
Work from Home +192 767 £47,683 -19.18% 187
East Midlands +174 741 £47,683 +92.18% 15
Scotland +265 572 £47,683 +96.71% 20
South West +65 553 £57,500 +15.00% 62
Yorkshire +188 224 £47,683 -39.08% 14
Wales +96 212 £65,000 +58.28% 14
East of England +32 211 £47,683 -17.07% 30
London +47 20 £45,000 -35.71% 84

BPSS Clearance
Co-occurring Skills and Capabilities by Category

The follow tables expand on the table above by listing co-occurrences grouped by category. The same employment type, locality and period is covered with up to 20 co-occurrences shown in each of the following categories:

Application Platforms
1 129 (1.63%) Confluence
2 94 (1.19%) SharePoint
3 26 (0.33%) Apache
4 4 (0.051%) Microsoft Exchange
5 3 (0.038%) Apache Airflow
6 2 (0.025%) ArcGIS
6 2 (0.025%) CMS
6 2 (0.025%) Headless CMS
6 2 (0.025%) nginx
7 1 (0.013%) Anypoint
7 1 (0.013%) Mule
7 1 (0.013%) Skype for Business
Applications
1 503 (6.35%) Simulink
2 480 (6.06%) Microsoft Office
3 280 (3.54%) Mathcad
4 228 (2.88%) Microsoft Excel
5 205 (2.59%) Microsoft PowerPoint
6 141 (1.78%) Abaqus
7 48 (0.61%) SOLIDWORKS
8 47 (0.59%) Microsoft Project
9 46 (0.58%) Windchill
10 41 (0.52%) Mathematica
11 4 (0.051%) Trello
12 1 (0.013%) AutoCAD
12 1 (0.013%) MS Visio
12 1 (0.013%) ProjectWise
12 1 (0.013%) Revit
12 1 (0.013%) Spreadsheet
Business Applications
1 490 (6.19%) Teamcenter
2 65 (0.82%) Sparx Enterprise Architect
3 50 (0.63%) SAP S/4HANA
4 44 (0.56%) Infor LN
5 40 (0.51%) SAP BPC
6 16 (0.20%) SAP ERP
7 8 (0.10%) Primavera
8 1 (0.013%) Raiser’s Edge
8 1 (0.013%) SAP MM
Cloud Services
1 56 (0.71%) AWS
2 42 (0.53%) Azure
3 24 (0.30%) Power Platform
4 18 (0.23%) GitHub
5 17 (0.21%) Azure DevOps
6 14 (0.18%) GitHub Actions
7 12 (0.15%) PaaS
8 10 (0.13%) Dynamics 365
8 10 (0.13%) Microsoft Copilot
9 9 (0.11%) GCP
9 9 (0.11%) SaaS
10 8 (0.10%) IaaS
11 7 (0.088%) Microsoft 365
12 4 (0.051%) Amazon CloudWatch
12 4 (0.051%) AWS CloudTrail
12 4 (0.051%) Azure Cosmos DB
12 4 (0.051%) Google Analytics
12 4 (0.051%) Google Data Studio
12 4 (0.051%) Google Sheets
12 4 (0.051%) Google Tag Manager
Communications & Networking
1 24 (0.30%) Wireshark
2 16 (0.20%) VoIP
3 4 (0.051%) LAN
4 3 (0.038%) WAN
4 3 (0.038%) Wi-Fi
5 2 (0.025%) HTTP
5 2 (0.025%) SAN
6 1 (0.013%) Network Security
6 1 (0.013%) Skype
6 1 (0.013%) Unified Communications
6 1 (0.013%) Wireless
Database & Business Intelligence
1 53 (0.67%) Tableau
2 30 (0.38%) Relational Database
3 28 (0.35%) MySQL
4 17 (0.21%) Power BI
4 17 (0.21%) SQL Server
5 8 (0.10%) PostgreSQL
6 5 (0.063%) Azure SQL Database
6 5 (0.063%) Data Warehouse
6 5 (0.063%) Redis
7 4 (0.051%) Power Query
8 2 (0.025%) Amazon RDS
8 2 (0.025%) GIS
8 2 (0.025%) MariaDB
9 1 (0.013%) NoSQL
9 1 (0.013%) SAP BW
9 1 (0.013%) SQL Server Integration Services
Development Applications
1 927 (11.71%) Rational DOORS
2 239 (3.02%) JIRA
3 109 (1.38%) LabVIEW
4 48 (0.61%) Git
5 42 (0.53%) Bitbucket
6 40 (0.51%) Oracle Forms
7 26 (0.33%) Eclipse
7 26 (0.33%) Eclipse RCP
8 21 (0.27%) eggPlant
9 15 (0.19%) Atlassian Bamboo
10 14 (0.18%) MagicDraw
11 13 (0.16%) SonarQube
12 9 (0.11%) Jenkins
13 5 (0.063%) ClearCase
13 5 (0.063%) JMeter
14 4 (0.051%) Gatling
14 4 (0.051%) JUnit
14 4 (0.051%) Subversion
14 4 (0.051%) Visual Studio
15 3 (0.038%) TestRail
General
1 1,107 (13.98%) Social Skills
2 894 (11.29%) Electronics
3 882 (11.14%) Aerospace
4 586 (7.40%) Presentation Skills
5 577 (7.29%) Manufacturing
6 557 (7.03%) Automotive
7 338 (4.27%) Analytical Skills
8 305 (3.85%) Finance
9 157 (1.98%) Law
10 153 (1.93%) Aeronautics
10 153 (1.93%) Avionics
11 90 (1.14%) Documentation Skills
12 89 (1.12%) Telecoms
13 83 (1.05%) Legal
14 59 (0.75%) Military
15 52 (0.66%) Influencing Skills
16 40 (0.51%) Police
17 38 (0.48%) Aviation
18 34 (0.43%) Public Sector
19 32 (0.40%) Agriculture
Job Titles
1 2,993 (37.80%) Senior
2 2,445 (30.88%) Systems Engineer
3 2,004 (25.31%) Principal Engineer
4 1,342 (16.95%) Principal Systems Engineer
5 957 (12.09%) Senior Systems Engineer
6 668 (8.44%) Engineering Manager
7 571 (7.21%) Lead
8 394 (4.98%) Senior Electrical Engineer
9 281 (3.55%) Support Engineer
10 275 (3.47%) Project Manager
11 265 (3.35%) Architect
12 260 (3.28%) Software Support Engineer
13 244 (3.08%) Software Engineer
14 232 (2.93%) Lead Systems Engineer
14 232 (2.93%) Senior Manager
15 231 (2.92%) Security Engineer
16 223 (2.82%) Integration Engineer
16 223 (2.82%) Systems Integration Engineer
17 208 (2.63%) Senior Data Warehouse Specialist
18 196 (2.48%) Team Leader
Libraries, Frameworks & Software Standards
1 54 (0.68%) Middleware
2 48 (0.61%) .NET
3 38 (0.48%) XML
4 32 (0.40%) CSS
4 32 (0.40%) HTML
5 26 (0.33%) JSP
6 17 (0.21%) ASP.NET
6 17 (0.21%) SAP Fiori
7 15 (0.19%) .NET Core
8 8 (0.10%) ARM Templates
8 8 (0.10%) Azure Blueprints
8 8 (0.10%) JSON
9 7 (0.088%) Django
9 7 (0.088%) OAuth
9 7 (0.088%) RESTful
10 6 (0.076%) REST
11 5 (0.063%) FastAPI
11 5 (0.063%) Flask
11 5 (0.063%) pytest
11 5 (0.063%) WebSockets
Miscellaneous
1 475 (6.00%) Management Information System
2 340 (4.29%) Algorithms
3 170 (2.15%) SCADA
4 87 (1.10%) Product Ownership
5 26 (0.33%) Onboarding
6 14 (0.18%) Acoustics
6 14 (0.18%) Embedded Systems
6 14 (0.18%) Self-Motivation
7 7 (0.088%) e-Learning
8 6 (0.076%) Analogue Electronics
9 5 (0.063%) CMDB
9 5 (0.063%) Data Centre
9 5 (0.063%) Driving Licence
10 4 (0.051%) Analytical Mindset
10 4 (0.051%) Social Media
11 3 (0.038%) Cloud Native
11 3 (0.038%) Data Protection Act
11 3 (0.038%) Legacy Systems
12 2 (0.025%) Pricing Data
12 2 (0.025%) Smartphone
Operating Systems
1 84 (1.06%) Linux
2 83 (1.05%) Windows
3 3 (0.038%) Android
3 3 (0.038%) Apple iOS
3 3 (0.038%) Windows Server
Processes & Methodologies
1 4,639 (58.59%) Systems Engineering
2 1,265 (15.98%) Agile
3 1,204 (15.21%) Model-Based Systems Engineering
4 1,147 (14.49%) Mathematics
5 1,113 (14.06%) SysML
5 1,113 (14.06%) Validation
6 848 (10.71%) Physics
7 819 (10.34%) UML
8 759 (9.59%) Project Management
9 743 (9.38%) Verification and Validation
10 721 (9.11%) Requirements Management
11 693 (8.75%) Cybersecurity
12 619 (7.82%) Stakeholder Management
13 578 (7.30%) Software Engineering
14 561 (7.09%) Coaching
15 541 (6.83%) Problem-Solving
16 537 (6.78%) MODAF
17 531 (6.71%) PLM
18 530 (6.69%) Decision-Making
19 518 (6.54%) Mentoring
Programming Languages
1 1,227 (15.50%) MATLAB
2 138 (1.74%) Python
3 118 (1.49%) R
4 108 (1.36%) C#
5 91 (1.15%) Ada
6 48 (0.61%) SQL
7 44 (0.56%) Java
8 37 (0.47%) C
9 23 (0.29%) Rust
10 18 (0.23%) Ada 95
11 17 (0.21%) ABAP
12 15 (0.19%) VB
13 9 (0.11%) C++
14 5 (0.063%) JavaScript
15 3 (0.038%) Perl
15 3 (0.038%) PHP
16 2 (0.025%) Ruby
17 1 (0.013%) Data Analysis Expressions
17 1 (0.013%) PowerShell
17 1 (0.013%) Scala
Qualifications
1 4,924 (62.19%) Degree
2 799 (10.09%) Chartered Engineer
3 723 (9.13%) HND
4 569 (7.19%) Master's Degree
5 520 (6.57%) HNC
6 232 (2.93%) Numerate Degree
7 211 (2.66%) CISSP
8 153 (1.93%) ISTQB
9 149 (1.88%) CISM
10 147 (1.86%) CESG Certified Professional
11 113 (1.43%) MBA
12 83 (1.05%) ACCA
12 83 (1.05%) CIMA
13 66 (0.83%) TOGAF Certification
14 64 (0.81%) Security Cleared
15 48 (0.61%) Computer Science Degree
16 33 (0.42%) SC Cleared
17 24 (0.30%) PRINCE2 Certification
17 24 (0.30%) Six Sigma Black Belt
17 24 (0.30%) Six Sigma Green Belt
Quality Assurance & Compliance
1 710 (8.97%) IEC 61508
2 632 (7.98%) ISO/IEC 15288
3 526 (6.64%) Def Stans
4 216 (2.73%) ISO 9001
5 185 (2.34%) DO-254
6 163 (2.06%) ARP4754
7 152 (1.92%) ISO/IEC 27001
7 152 (1.92%) NIST
8 147 (1.86%) JSP 440
8 147 (1.86%) RMADS
9 118 (1.49%) HAZOP
10 108 (1.36%) ISO/IEC 17025
11 85 (1.07%) ISO/IEC 12207
12 80 (1.01%) AQAP
13 49 (0.62%) Data Quality
14 44 (0.56%) IFRS
15 40 (0.51%) GAAP
16 22 (0.28%) QA
17 13 (0.16%) Accessibility
18 10 (0.13%) NCSC
System Software
1 22 (0.28%) Firmware
2 19 (0.24%) Docker
3 2 (0.025%) Active Directory
4 1 (0.013%) Slurm Workload Manager
Systems Management
1 141 (1.78%) Functional Safety
2 35 (0.44%) Ansible
3 19 (0.24%) Kubernetes
4 12 (0.15%) Terraform
5 5 (0.063%) Grafana
5 5 (0.063%) Prometheus
6 1 (0.013%) HP Quality Center
6 1 (0.013%) Microsoft Intune
6 1 (0.013%) Packer
Vendors
1 507 (6.40%) IBM
2 355 (4.48%) Microsoft
3 228 (2.88%) SAP
4 196 (2.48%) ANSYS
5 185 (2.34%) Siemens
6 132 (1.67%) MathWorks
7 65 (0.82%) Sparx
8 56 (0.71%) Oracle
9 47 (0.59%) Atlassian
10 44 (0.56%) Infor
11 40 (0.51%) Cognos
12 21 (0.27%) Keysight
13 16 (0.20%) Mercator
14 8 (0.10%) NEC
14 8 (0.10%) ServiceNow
15 7 (0.088%) Google
16 6 (0.076%) Mentor Graphics
17 4 (0.051%) Hyperion
18 3 (0.038%) Salesforce
19 2 (0.025%) Dell