Coaching Jobs

Coaching
UK

The table below provides summary statistics for permanent job vacancies requiring Coaching skills. It includes a benchmarking guide to the annual salaries offered in vacancies that cited Coaching over the 6 months leading up to 8 May 2025, comparing them to the same period in the previous two years.

6 months to
8 May 2025
Same period 2024 Same period 2023
Rank 33 45 40
Rank change year-on-year +12 -5 +7
Permanent jobs citing Coaching 3,425 4,813 6,801
As % of all permanent jobs advertised in the UK 6.34% 4.87% 6.62%
As % of the Processes & Methodologies category 6.76% 5.68% 6.93%
Number of salaries quoted 962 2,832 2,069
10th Percentile £38,500 £36,125 £35,483
25th Percentile £48,000 £42,500 £50,000
Median annual salary (50th Percentile) £55,000 £60,000 £65,600
Median % change year-on-year -8.33% -8.54% -2.81%
75th Percentile £75,000 £75,772 £85,000
90th Percentile £97,528 £87,500 £100,000
UK excluding London median annual salary £54,793 £57,965 £60,000
% change year-on-year -5.47% -3.39% -

All Process and Methodology Skills
UK

Coaching falls under the Processes and Methodologies category. For comparison with the information above, the following table provides summary statistics for all permanent job vacancies requiring process or methodology skills.

Permanent vacancies with a requirement for process or methodology skills 50,654 84,747 98,202
As % of all permanent jobs advertised in the UK 93.80% 85.73% 95.63%
Number of salaries quoted 26,617 59,812 57,648
10th Percentile £30,000 £29,000 £34,000
25th Percentile £42,500 £40,000 £45,000
Median annual salary (50th Percentile) £57,500 £55,000 £61,180
Median % change year-on-year +4.55% -10.10% +1.97%
75th Percentile £75,000 £72,500 £81,250
90th Percentile £98,474 £92,500 £100,000
UK excluding London median annual salary £52,500 £50,000 £55,000
% change year-on-year +5.00% -9.09% +4.76%

Coaching
Job Vacancy Trend

Job postings citing Coaching as a proportion of all IT jobs advertised.
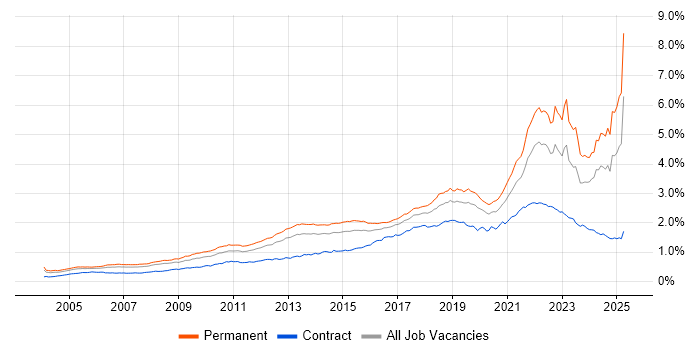
Job vacancy trend for Coaching in the UK

Coaching
Salary Trend

3-month moving average salary quoted in jobs citing Coaching.

Salary trend for Coaching in the UK

Coaching
Salary Histogram

Salary distribution for jobs citing Coaching over the 6 months to 8 May 2025.

Salary histogram for Coaching in the UK

Coaching
Top 17 Job Locations

The table below looks at the demand and provides a guide to the median salaries quoted in IT jobs citing Coaching within the UK over the 6 months to 8 May 2025. The 'Rank Change' column provides an indication of the change in demand within each location based on the same 6 month period last year.

Location Rank Change
on Same Period
Last Year
Matching
Permanent
IT Job Ads
Median Salary
Past 6 Months
Median Salary
% Change
on Same Period
Last Year
Live
Jobs
England +9 3,070 £55,000 -8.33% 2,531
UK excluding London +13 2,892 £54,793 -5.47% 1,636
North of England -10 795 £54,793 -5.47% 479
South East +33 767 £60,750 +10.45% 429
North West -11 596 £54,793 -5.47% 288
Work from Home -57 559 £65,000 +4.00% 2,190
London -1 477 £72,500 +6.09% 1,181
East of England +34 433 £70,000 +21.74% 134
Midlands +10 411 £48,000 -17.19% 273
East Midlands +39 283 £42,500 -19.05% 101
Scotland +34 243 £66,934 +2.97% 112
South West +32 199 £58,000 +0.87% 173
Yorkshire -26 135 £70,000 +11.50% 131
West Midlands -42 128 £48,000 -18.30% 160
North East -13 64 £48,000 -21.58% 65
Wales +4 37 £59,857 +13.50% 37
Northern Ireland +22 20 - - 36

Coaching
Co-occurring Skills and Capabilities by Category

The follow tables expand on the table above by listing co-occurrences grouped by category. The same employment type, locality and period is covered with up to 20 co-occurrences shown in each of the following categories:

Application Platforms
1 63 (1.84%) Confluence
2 39 (1.14%) SharePoint
3 28 (0.82%) CMS
4 19 (0.55%) Microsoft Exchange
5 7 (0.20%) SAS
6 6 (0.18%) Adobe Experience Manager
7 4 (0.12%) IBM Domino
7 4 (0.12%) Moodle
8 3 (0.088%) NetWeaver
9 2 (0.058%) Apache
9 2 (0.058%) Apache Spark
9 2 (0.058%) NServiceBus
9 2 (0.058%) OpenStack
9 2 (0.058%) ThingWorx
9 2 (0.058%) WordPress
10 1 (0.029%) Apache Airflow
10 1 (0.029%) Appian
10 1 (0.029%) Luigi
10 1 (0.029%) Mendix
10 1 (0.029%) Oracle Workflow
Applications
1 130 (3.80%) Microsoft Office
2 83 (2.42%) Microsoft Excel
3 73 (2.13%) Simulink
4 54 (1.58%) Microsoft PowerPoint
5 9 (0.26%) Trello
6 6 (0.18%) Microsoft Project
6 6 (0.18%) Windchill
7 3 (0.088%) MS Visio
7 3 (0.088%) Productboard
7 3 (0.088%) SPSS
8 2 (0.058%) Adobe Creative Suite
9 1 (0.029%) InDesign
9 1 (0.029%) Spreadsheet
9 1 (0.029%) Stata
Business Applications
1 22 (0.64%) Dynamics AX
2 13 (0.38%) Dynamics CRM
3 8 (0.23%) Salesforce CRM
3 8 (0.23%) SAP S/4HANA
4 6 (0.18%) Teamcenter
5 5 (0.15%) Oracle EBS
6 4 (0.12%) Adobe Campaign
6 4 (0.12%) Oracle ERP
6 4 (0.12%) PeopleSoft HCM
6 4 (0.12%) Relativity
6 4 (0.12%) Ringtail
6 4 (0.12%) SAP HCM
6 4 (0.12%) Veritas eDiscovery
7 3 (0.088%) CA PPM
7 3 (0.088%) Sage 50
7 3 (0.088%) SAP Hybris
8 2 (0.058%) NEC Housing
8 2 (0.058%) Oracle Retail
8 2 (0.058%) PeopleSoft Financials
8 2 (0.058%) SAP MDG
Cloud Services
1 318 (9.28%) Azure
2 187 (5.46%) AWS
3 106 (3.09%) SaaS
4 103 (3.01%) Power Platform
5 99 (2.89%) Azure DevOps
6 79 (2.31%) Microsoft 365
7 65 (1.90%) GCP
8 64 (1.87%) PaaS
9 44 (1.28%) Serverless
10 43 (1.26%) GitHub
11 32 (0.93%) Dynamics 365
12 27 (0.79%) AWS Lambda
13 25 (0.73%) Amazon SQS
14 20 (0.58%) Cloud Computing
15 18 (0.53%) Boomi
16 17 (0.50%) Entra ID
17 15 (0.44%) AWS Step Functions
17 15 (0.44%) iPaaS
18 14 (0.41%) AWS CodeBuild
18 14 (0.41%) AWS CodeDeploy
Communications & Networking
1 739 (21.58%) Wireless
2 737 (21.52%) Wi-Fi
3 730 (21.31%) 5G
3 730 (21.31%) Bluetooth
3 730 (21.31%) GSM
3 730 (21.31%) LTE
3 730 (21.31%) UMTS
4 78 (2.28%) VPN
5 70 (2.04%) TCP/IP
6 30 (0.88%) Firewall
7 29 (0.85%) VoIP
8 12 (0.35%) WAN
9 10 (0.29%) Network Security
10 9 (0.26%) DNS
10 9 (0.26%) LAN
10 9 (0.26%) VLAN
11 7 (0.20%) SD-WAN
12 6 (0.18%) DHCP
13 5 (0.15%) Intrusion Detection
13 5 (0.15%) IPsec
Database & Business Intelligence
1 75 (2.19%) SQL Server
2 74 (2.16%) Power BI
3 59 (1.72%) Relational Database
4 53 (1.55%) MySQL
5 30 (0.88%) PostgreSQL
6 27 (0.79%) Tableau
7 25 (0.73%) NoSQL
8 22 (0.64%) Data Warehouse
9 21 (0.61%) Big Data
10 14 (0.41%) MongoDB
11 13 (0.38%) Cloud Spanner
11 13 (0.38%) Data Lake
12 12 (0.35%) BigQuery
13 11 (0.32%) Looker
14 10 (0.29%) BusinessObjects
14 10 (0.29%) SQL Server Integration Services
15 9 (0.26%) QlikView
16 8 (0.23%) Data Mining
17 7 (0.20%) RDBMS
17 7 (0.20%) SQL Server Reporting Services
Development Applications
1 109 (3.18%) JIRA
2 93 (2.72%) Git
3 69 (2.01%) Cucumber
4 64 (1.87%) Robot Framework
5 40 (1.17%) Bitbucket
6 29 (0.85%) Jenkins
7 23 (0.67%) GitLab
7 23 (0.67%) Rational DOORS
8 12 (0.35%) SonarQube
9 10 (0.29%) webpack
10 8 (0.23%) Gradle
10 8 (0.23%) Selenium
11 7 (0.20%) ClearCase
11 7 (0.20%) Grunt
12 6 (0.18%) Jasmine
12 6 (0.18%) Mocha
12 6 (0.18%) Visual Studio
13 5 (0.15%) Postman
13 5 (0.15%) TeamCity
14 4 (0.12%) XCUITest
General
1 847 (24.73%) Social Skills
2 760 (22.19%) Electronics
3 669 (19.53%) Finance
4 359 (10.48%) Manufacturing
5 299 (8.73%) Analytical Skills
6 278 (8.12%) Inclusion and Diversity
7 204 (5.96%) Banking
8 198 (5.78%) Aerospace
9 184 (5.37%) Retail
10 154 (4.50%) Aeronautics
11 129 (3.77%) Telecoms
12 128 (3.74%) Public Sector
13 125 (3.65%) Legal
14 113 (3.30%) Influencing Skills
15 111 (3.24%) Marketing
16 93 (2.72%) Law
17 87 (2.54%) Presentation Skills
18 74 (2.16%) Automotive
19 73 (2.13%) Organisational Skills
20 60 (1.75%) Games
Job Titles
1 846 (24.70%) Senior
2 819 (23.91%) Test Engineer
3 730 (21.31%) Electronics Engineer
3 730 (21.31%) Electronics Test Engineer
4 533 (15.56%) Lead
5 436 (12.73%) Systems Engineer
6 411 (12.00%) Senior Systems Engineer
7 193 (5.64%) Principal Engineer
8 183 (5.34%) Team Leader
9 160 (4.67%) Principal Systems Engineer
10 131 (3.82%) Lead Systems Engineer
11 127 (3.71%) Integration Engineer
11 127 (3.71%) System Verification Engineer
11 127 (3.71%) Systems Integration Engineer
11 127 (3.71%) Validation Engineer
12 110 (3.21%) Developer
13 98 (2.86%) Analyst
14 94 (2.74%) Technical Manager
14 94 (2.74%) Technical Support
15 93 (2.72%) Senior Manager
Libraries, Frameworks & Software Standards
1 129 (3.77%) .NET
2 72 (2.10%) React
3 60 (1.75%) AngularJS
4 51 (1.49%) RESTful
5 31 (0.91%) .NET Framework
6 27 (0.79%) CSS
7 24 (0.70%) Kafka
8 22 (0.64%) Node.js
8 22 (0.64%) Spring Boot
9 21 (0.61%) JWT
9 21 (0.61%) OAuth
10 20 (0.58%) .NET Core
10 20 (0.58%) HTML
10 20 (0.58%) REST
11 19 (0.55%) Middleware
12 17 (0.50%) React Native
13 16 (0.47%) YAML
14 14 (0.41%) Spring
15 13 (0.38%) Vue
16 12 (0.35%) XML
Miscellaneous
1 747 (21.81%) Driving Licence
2 147 (4.29%) Management Information System
3 94 (2.74%) Product Ownership
4 69 (2.01%) e-Learning
5 68 (1.99%) Linux Command Line
6 64 (1.87%) Hybrid Cloud
7 57 (1.66%) FMCG
8 55 (1.61%) Robotics
9 54 (1.58%) Blockchain
10 49 (1.43%) Public Cloud
11 35 (1.02%) Cloud Native
12 34 (0.99%) Data Structures
12 34 (0.99%) Self-Motivation
13 32 (0.93%) Onboarding
13 32 (0.93%) Security Posture
14 26 (0.76%) Social Media
15 24 (0.70%) Greenfield Project
15 24 (0.70%) PMI
16 23 (0.67%) Algorithms
16 23 (0.67%) Legacy Systems
Operating Systems
1 183 (5.34%) Windows
2 158 (4.61%) Linux
3 32 (0.93%) Apple iOS
4 22 (0.64%) Windows Server
5 18 (0.53%) Android
6 14 (0.41%) Windows 10
7 10 (0.29%) Windows Vista
8 7 (0.20%) Mac OS
9 4 (0.12%) Unix
10 2 (0.058%) CoreOS
10 2 (0.058%) Oracle Linux
10 2 (0.058%) Windows Server 2012
10 2 (0.058%) zOS
11 1 (0.029%) Debian
11 1 (0.029%) Windows 7
11 1 (0.029%) Windows Server 2016
11 1 (0.029%) Windows Server 2019
Processes & Methodologies
1 1,779 (51.94%) Mentoring
2 890 (25.99%) Validation
3 879 (25.66%) Verification and Validation
4 798 (23.30%) Agile
5 795 (23.21%) Customer Requirements
6 741 (21.64%) Test Strategy
7 625 (18.25%) Systems Engineering
8 509 (14.86%) Mathematics
9 496 (14.48%) Problem-Solving
10 490 (14.31%) Physics
11 442 (12.91%) Continuous Improvement
12 347 (10.13%) DevOps
13 276 (8.06%) Project Management
14 274 (8.00%) Service Delivery
15 264 (7.71%) Analytics
16 261 (7.62%) Risk Management
17 259 (7.56%) Stakeholder Management
18 233 (6.80%) Customer Service
19 225 (6.57%) Creative Thinking
20 224 (6.54%) Customer Experience
Programming Languages
1 193 (5.64%) Python
2 166 (4.85%) SQL
3 161 (4.70%) JavaScript
4 143 (4.18%) C#
5 107 (3.12%) Java
6 104 (3.04%) PowerShell
7 77 (2.25%) Bash
8 62 (1.81%) TypeScript
9 25 (0.73%) R
10 24 (0.70%) MATLAB
11 13 (0.38%) Kotlin
11 13 (0.38%) Swift
12 12 (0.35%) VBA
13 11 (0.32%) C++
13 11 (0.32%) T-SQL
14 10 (0.29%) Go
14 10 (0.29%) PHP
15 9 (0.26%) C
15 9 (0.26%) Objective-C
16 8 (0.23%) Bicep
Qualifications
1 1,640 (47.88%) Degree
2 953 (27.82%) HND
3 561 (16.38%) BPSS Clearance
4 178 (5.20%) NVQ Level 4
5 105 (3.07%) Security Cleared
6 96 (2.80%) HNC
7 87 (2.54%) NVQ Level 3
8 85 (2.48%) Chartered Engineer
9 61 (1.78%) CRISC
10 49 (1.43%) ACCA
11 47 (1.37%) CISA
12 46 (1.34%) SC Cleared
13 42 (1.23%) Master's Degree
14 40 (1.17%) DBS Check
15 39 (1.14%) Computer Science Degree
16 34 (0.99%) Microsoft Certification
17 33 (0.96%) PMI Certification
18 30 (0.88%) CISSP
19 29 (0.85%) DV Cleared
20 28 (0.82%) Six Sigma Black Belt
Quality Assurance & Compliance
1 163 (4.76%) ARP4754
1 163 (4.76%) DO-254
1 163 (4.76%) IEC 61508
2 159 (4.64%) QA
3 96 (2.80%) ISO 9001
4 80 (2.34%) AQAP
5 64 (1.87%) ITGC
6 63 (1.84%) ISO/IEC 27001
7 42 (1.23%) COBIT
8 41 (1.20%) NIST
9 40 (1.17%) Data Quality
10 37 (1.08%) Accessibility
11 29 (0.85%) GAAP
11 29 (0.85%) GDPR
11 29 (0.85%) IFRS
12 27 (0.79%) Sarbanes-Oxley
13 25 (0.73%) PMO
14 24 (0.70%) SLA
15 19 (0.55%) Cyber Essentials
16 18 (0.53%) NCSC
System Software
1 62 (1.81%) Docker
2 39 (1.14%) Active Directory
3 10 (0.29%) Virtual Desktop
4 9 (0.26%) Hyper-V
5 8 (0.23%) VMware Infrastructure
6 7 (0.20%) Virtual Machines
7 6 (0.18%) Embedded Firmware
7 6 (0.18%) Firmware
7 6 (0.18%) Virtual Servers
8 1 (0.029%) Snort
8 1 (0.029%) VMware ESXi
8 1 (0.029%) vSphere
Systems Management
1 76 (2.22%) Kubernetes
2 51 (1.49%) Terraform
3 50 (1.46%) Ansible
4 16 (0.47%) Microsoft Intune
5 7 (0.20%) Grafana
6 6 (0.18%) Puppet
6 6 (0.18%) SCCM
7 5 (0.15%) Argo
7 5 (0.15%) CASB
7 5 (0.15%) Progress Chef
7 5 (0.15%) Prometheus
8 4 (0.12%) Single Sign-On
9 3 (0.088%) Control-M
9 3 (0.088%) FortiGate
10 2 (0.058%) CA Endevor
10 2 (0.058%) QRadar
10 2 (0.058%) WMI
10 2 (0.058%) ZABBIX
11 1 (0.029%) Consul
11 1 (0.029%) RSA Archer
Vendors
1 319 (9.31%) Microsoft
2 78 (2.28%) Oracle
3 65 (1.90%) IBM
4 58 (1.69%) Google
5 53 (1.55%) Red Hat
6 50 (1.46%) MathWorks
7 49 (1.43%) SAP
8 44 (1.28%) Atlassian
9 43 (1.26%) Salesforce
10 34 (0.99%) Adobe
11 32 (0.93%) Siemens
12 31 (0.91%) ServiceNow
13 28 (0.82%) Databricks
14 27 (0.79%) Micro Focus
15 26 (0.76%) Cisco
16 25 (0.73%) BT
17 24 (0.70%) Informatica
18 23 (0.67%) TikTok
19 21 (0.61%) Facebook
20 15 (0.44%) Apple