IoT Job Trends

IoT (Internet of Things, Internet of Everything)
UK

The table below looks at the prevalence of the term IoT in permanent job vacancies. Included is a benchmarking guide to the salaries offered in vacancies that cited IoT over the 6 months leading up to 25 November 2025, comparing them to the same period in the previous two years.

6 months to
25 Nov 2025
Same period 2024 Same period 2023
Rank 69 307 387
Rank change year-on-year +238 +80 +6
Permanent jobs citing IoT 1,881 551 377
As % of all permanent jobs in the UK 3.53% 0.82% 0.73%
As % of the Miscellaneous category 9.87% 2.43% 1.90%
Number of salaries quoted 201 342 301
10th Percentile £33,500 £32,500 £40,000
25th Percentile £41,250 £47,500 £52,500
Median annual salary (50th Percentile) £57,500 £57,500 £65,000
Median % change year-on-year - -11.54% -3.70%
75th Percentile £70,000 £70,000 £77,500
90th Percentile £85,000 £84,625 £90,000
UK excluding London median annual salary £55,000 £55,000 £60,000
% change year-on-year - -8.33% -4.76%

All Generic Skills
UK

IoT falls under the General and Transferable Skills category. For comparison with the information above, the following table provides summary statistics for all permanent job vacancies requiring generic IT skills.

Permanent vacancies with a requirement for generic IT skills 19,055 22,662 19,814
As % of all permanent jobs advertised in the UK 35.71% 33.72% 38.47%
Number of salaries quoted 10,686 11,062 14,835
10th Percentile £27,750 £33,750 £33,714
25th Percentile £36,250 £45,000 £45,000
Median annual salary (50th Percentile) £54,285 £60,000 £62,500
Median % change year-on-year -9.53% -4.00% -
75th Percentile £77,500 £82,500 £84,056
90th Percentile £100,000 £110,000 £107,500
UK excluding London median annual salary £45,000 £54,000 £55,000
% change year-on-year -16.67% -1.82% -

IoT
Job Vacancy Trend

Historical trend showing the proportion of permanent IT job postings citing IoT relative to all permanent IT jobs advertised.
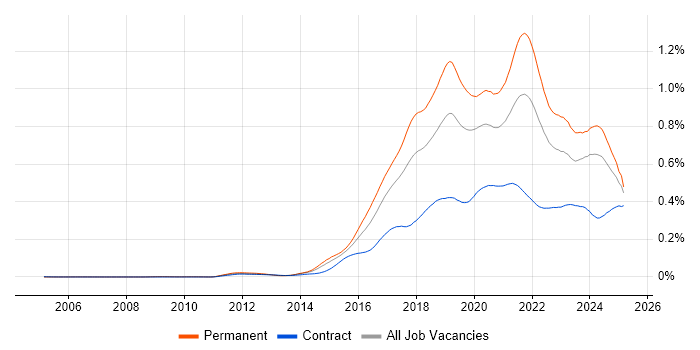
IoT job vacancy trend in the UK

IoT
Salary Trend

Salary distribution trend for jobs in the UK citing IoT.

Salary distribution trend for jobs in the UK citing IoT

IoT
Salary Histogram

Salary distribution for jobs citing IoT over the 6 months to 25 November 2025.

Salary histogram for IoT in the UK

IoT
Top 18 Job Locations

The table below looks at the demand and provides a guide to the median salaries quoted in IT jobs citing IoT within the UK over the 6 months to 25 November 2025. The 'Rank Change' column provides an indication of the change in demand within each location based on the same 6 month period last year.

Location Rank Change
on Same Period
Last Year
Matching
Permanent
IT Job Ads
Median Salary
Past 6 Months
Median Salary
% Change
on Same Period
Last Year
Live
Jobs
England +284 1,833 £57,500 -4.17% 187
UK excluding London +221 1,566 £55,000 - 161
North of England +223 661 £55,000 +37.50% 28
North West +184 606 £55,000 +46.67% 20
South East +156 435 £65,000 +6.12% 70
London +213 297 £65,000 - 48
East of England +107 295 £57,500 +4.55% 19
Midlands +64 84 £55,000 -8.33% 17
East Midlands +56 72 £55,000 -8.33% 4
Work from Home -20 65 £60,000 - 98
South West +47 55 £45,000 -21.74% 20
Yorkshire +55 54 £55,000 -21.43% 6
Wales +14 31 £51,500 +87.27% 5
West Midlands +29 12 £50,000 -16.67% 13
Channel Islands - 6 - -
Northern Ireland +3 4 £70,000 -
Scotland -6 3 £57,250 +24.46% 5
North East +18 1 £40,000 -20.79% 2

IoT
Co-Occurring Skills & Capabilities by Category

The following tables expand on the one above by listing co-occurrences grouped by category. They cover the same employment type, locality and period, with up to 20 co-occurrences shown in each category:

Application Platforms
1 36 (1.91%) SharePoint
2 16 (0.85%) Confluence
3 2 (0.11%) Apache Airflow
3 2 (0.11%) Microsoft Exchange
3 2 (0.11%) nginx
3 2 (0.11%) Skype for Business
4 1 (0.053%) Apache Spark
Applications
1 6 (0.32%) AutoCAD
1 6 (0.32%) Microsoft Project
1 6 (0.32%) MS Visio
1 6 (0.32%) Revit
2 3 (0.16%) Microsoft Excel
3 1 (0.053%) Microsoft PowerPoint
Business Applications
1 6 (0.32%) NetSuite
2 4 (0.21%) Oracle ERP
2 4 (0.21%) SAP S/4HANA
3 3 (0.16%) SAP EWM
3 3 (0.16%) SAP SCM
4 2 (0.11%) Dynamics CRM
4 2 (0.11%) Integrated Workplace Management System
4 2 (0.11%) SAP APO
4 2 (0.11%) SAP IBP
4 2 (0.11%) SAP MM
4 2 (0.11%) SAP PP
5 1 (0.053%) Fidessa
5 1 (0.053%) Maximo
5 1 (0.053%) SAP CO
5 1 (0.053%) SAP FI
5 1 (0.053%) SAP FI/CO
5 1 (0.053%) SAP LE
5 1 (0.053%) SAP QM
5 1 (0.053%) SAP SD
5 1 (0.053%) SAP WM
Cloud Services
1 1,609 (85.54%) Cloud Computing
2 60 (3.19%) Azure
3 35 (1.86%) AWS
4 25 (1.33%) Entra ID
5 24 (1.28%) Power Platform
6 20 (1.06%) Power Automate
7 18 (0.96%) Serverless
8 17 (0.90%) PowerApps
9 11 (0.58%) GCP
10 10 (0.53%) SaaS
11 6 (0.32%) Microsoft 365
12 5 (0.27%) GitHub
13 4 (0.21%) Dynamics 365
13 4 (0.21%) Google Workspace
13 4 (0.21%) IaaS
13 4 (0.21%) PaaS
13 4 (0.21%) SurveyMonkey
13 4 (0.21%) Zapier
14 3 (0.16%) Azure Functions
14 3 (0.16%) Firebase
Communications & Networking
1 1,630 (86.66%) Internet
2 42 (2.23%) Network Security
3 33 (1.75%) Wireless
4 30 (1.59%) Modbus
5 26 (1.38%) MQTT
6 14 (0.74%) Ethernet
7 13 (0.69%) TCP/IP
8 12 (0.64%) Firewall
9 11 (0.58%) Bluetooth
9 11 (0.58%) WAN
10 9 (0.48%) 5G
11 8 (0.43%) VLAN
12 7 (0.37%) LAN
13 6 (0.32%) LoRaWAN
13 6 (0.32%) Wi-Fi
14 5 (0.27%) Broadband
14 5 (0.27%) Intrusion Detection
14 5 (0.27%) VoIP
14 5 (0.27%) ZigBee
15 4 (0.21%) VPN
Database & Business Intelligence
1 14 (0.74%) Big Data
2 11 (0.58%) MySQL
3 8 (0.43%) MongoDB
4 7 (0.37%) Power BI
5 6 (0.32%) PostgreSQL
6 5 (0.27%) SQL Server
7 4 (0.21%) ClickHouse
7 4 (0.21%) NoSQL
8 3 (0.16%) Data Lake
8 3 (0.16%) DynamoDB
9 2 (0.11%) Azure SQL Database
9 2 (0.11%) Data Warehouse
9 2 (0.11%) InfluxDB
9 2 (0.11%) Metadata
9 2 (0.11%) Relational Database
10 1 (0.053%) Amazon RDS
10 1 (0.053%) Delta Lake
10 1 (0.053%) Elasticsearch
10 1 (0.053%) GIS
10 1 (0.053%) Redis
Development Applications
1 23 (1.22%) JIRA
2 8 (0.43%) Git
3 4 (0.21%) Burp Suite
3 4 (0.21%) GitLab
3 4 (0.21%) Metasploit
4 2 (0.11%) Jaeger
4 2 (0.11%) Jenkins
4 2 (0.11%) MLflow
4 2 (0.11%) Sonatype Nexus
5 1 (0.053%) Bitbucket
5 1 (0.053%) Cypress.io
5 1 (0.053%) Postman
5 1 (0.053%) Rational DOORS
5 1 (0.053%) Selenium
5 1 (0.053%) SoapUI
General
1 1,689 (89.79%) Social Skills
2 1,614 (85.81%) Inclusion and Diversity
3 1,608 (85.49%) Banking
4 46 (2.45%) Manufacturing
5 30 (1.59%) Finance
6 25 (1.33%) Marketing
7 23 (1.22%) Analytical Skills
8 22 (1.17%) Electronics
9 21 (1.12%) Automotive
10 17 (0.90%) Pharmaceutical
11 16 (0.85%) Public Sector
12 14 (0.74%) Retail
13 11 (0.58%) Telecoms
14 9 (0.48%) Aerospace
14 9 (0.48%) Law
15 7 (0.37%) Tech for Good
16 6 (0.32%) Wearables
17 5 (0.27%) Back Office
17 5 (0.27%) Billing
17 5 (0.27%) Documentation Skills
Job Titles
1 1,300 (69.11%) Lecturer
2 38 (2.02%) Developer
3 35 (1.86%) Senior
4 21 (1.12%) Architect
4 21 (1.12%) Software Engineer
5 15 (0.80%) Lead
5 15 (0.80%) Systems Engineer
6 14 (0.74%) React Developer
7 12 (0.64%) Mobile Developer
8 11 (0.58%) Automation Engineer
8 11 (0.58%) Embedded Engineer
9 10 (0.53%) Firmware Engineer
9 10 (0.53%) Senior Developer
9 10 (0.53%) Senior Systems Engineer
9 10 (0.53%) Solutions Architect
10 9 (0.48%) Applications Developer
10 9 (0.48%) Sales Manager
11 8 (0.43%) Analyst
11 8 (0.43%) Backend Developer
11 8 (0.43%) IoT Developer
Libraries, Frameworks & Software Standards
1 17 (0.90%) .NET
2 13 (0.69%) React Native
3 9 (0.48%) React
4 8 (0.43%) Node.js
4 8 (0.43%) REST
5 7 (0.37%) CSS
6 6 (0.32%) AngularJS
7 5 (0.27%) OpenAPI
7 5 (0.27%) Swagger
8 4 (0.21%) Django
8 4 (0.21%) FastAPI
8 4 (0.21%) Kafka
9 3 (0.16%) 802.1X
9 3 (0.16%) ASP.NET Web API
9 3 (0.16%) HTML
9 3 (0.16%) SAP Fiori
9 3 (0.16%) SAPUI5
10 2 (0.11%) .NET Core
10 2 (0.11%) Keycloak
10 2 (0.11%) Yocto
Miscellaneous
1 24 (1.28%) SCADA
2 22 (1.17%) Operational Technology
3 18 (0.96%) Management Information System
4 16 (0.85%) Industry 4.0
4 16 (0.85%) Mobile App
5 15 (0.80%) Renewable Energy
6 13 (0.69%) Biopharmaceutical
7 12 (0.64%) Data Centre
8 10 (0.53%) Embedded Systems
9 9 (0.48%) Self-Motivation
10 7 (0.37%) Cloud Native
10 7 (0.37%) Driving Licence
10 7 (0.37%) Home Automation
10 7 (0.37%) Onboarding
11 6 (0.32%) Analytical Mindset
11 6 (0.32%) Device Driver
11 6 (0.32%) Digital Signage
11 6 (0.32%) Greenfield Project
11 6 (0.32%) Product Ownership
11 6 (0.32%) Video Conferencing
Operating Systems
1 17 (0.90%) Linux
1 17 (0.90%) Windows
2 10 (0.53%) Unix
3 8 (0.43%) Android
4 5 (0.27%) Ubuntu
5 4 (0.21%) Kali Linux
6 3 (0.16%) Windows Server
7 2 (0.11%) Apple iOS
7 2 (0.11%) Embedded Linux
8 1 (0.053%) Solaris
8 1 (0.053%) Windows 10
Processes & Methodologies
1 1,672 (88.89%) Cybersecurity
2 1,627 (86.50%) AI
3 1,619 (86.07%) Machine Learning
4 1,610 (85.59%) User Experience
5 1,607 (85.43%) Web Development
6 61 (3.24%) Agile
7 45 (2.39%) Problem-Solving
8 36 (1.91%) Mentoring
9 35 (1.86%) Software Engineering
10 34 (1.81%) DevOps
11 33 (1.75%) Project Management
12 31 (1.65%) Customer Service
13 29 (1.54%) Roadmaps
14 28 (1.49%) Business Development
15 27 (1.44%) Continuous Improvement
16 25 (1.33%) Project Delivery
17 24 (1.28%) Prototyping
18 23 (1.22%) Computer Science
19 22 (1.17%) Analytics
20 20 (1.06%) Decision-Making
Programming Languages
1 50 (2.66%) Python
2 24 (1.28%) C++
3 23 (1.22%) C#
3 23 (1.22%) SQL
4 18 (0.96%) Java
5 17 (0.90%) PowerShell
6 15 (0.80%) C
7 14 (0.74%) JavaScript
8 12 (0.64%) TypeScript
9 10 (0.53%) PHP
10 9 (0.48%) Ruby
11 8 (0.43%) Elixir
11 8 (0.43%) Go
12 4 (0.21%) R
12 4 (0.21%) Rust
13 3 (0.16%) Bash
14 2 (0.11%) Embedded C
14 2 (0.11%) Perl
14 2 (0.11%) VBA
15 1 (0.053%) Embedded C++
Qualifications
1 1,660 (88.25%) Degree
2 1,611 (85.65%) Master's Degree
3 1,603 (85.22%) PhD
4 1,599 (85.01%) Postgraduate
5 23 (1.22%) HND
6 20 (1.06%) Security Cleared
7 15 (0.80%) HNC
8 13 (0.69%) Chartered Engineer
8 13 (0.69%) SC Cleared
9 8 (0.43%) BPSS Clearance
9 8 (0.43%) Computer Science Degree
10 5 (0.27%) PMI Certification
10 5 (0.27%) PMP
11 3 (0.16%) SAP Certification
12 2 (0.11%) CISA
12 2 (0.11%) CISM
12 2 (0.11%) CISSP
12 2 (0.11%) MCP
13 1 (0.053%) CCNA
13 1 (0.053%) CCNP
Quality Assurance & Compliance
1 21 (1.12%) QA
2 5 (0.27%) GDPR
3 4 (0.21%) Data Quality
3 4 (0.21%) ISO/IEC 27001
4 3 (0.16%) SLA
5 2 (0.11%) NIST
6 1 (0.053%) Accessibility
6 1 (0.053%) Cyber Essentials
6 1 (0.053%) Cyber Essentials PLUS
6 1 (0.053%) ISO 9001
6 1 (0.053%) JTAG
6 1 (0.053%) PCI DSS
6 1 (0.053%) SOC 2
System Software
1 23 (1.22%) Firmware
2 12 (0.64%) VMware Infrastructure
3 11 (0.58%) VMware ESXi
4 8 (0.43%) Docker
5 6 (0.32%) Embedded Firmware
6 5 (0.27%) Active Directory
7 2 (0.11%) NFS
8 1 (0.053%) Virtual Machines
Systems Management
1 23 (1.22%) Microsoft Intune
2 13 (0.69%) Functional Safety
3 9 (0.48%) Kubernetes
4 5 (0.27%) Grafana
5 4 (0.21%) Nessus
5 4 (0.21%) Nmap
5 4 (0.21%) Terraform
6 2 (0.11%) Ansible
6 2 (0.11%) Argo
6 2 (0.11%) Prometheus
7 1 (0.053%) Kibana
Vendors
1 52 (2.76%) Microsoft
2 16 (0.85%) Atlassian
3 14 (0.74%) Cisco
3 14 (0.74%) Siemens
4 13 (0.69%) AVEVA
4 13 (0.69%) Rockwell
5 12 (0.64%) SAP
5 12 (0.64%) VMware
6 10 (0.53%) Google
7 7 (0.37%) Oracle
8 6 (0.32%) Autodesk
8 6 (0.32%) NEC
8 6 (0.32%) Panasonic
8 6 (0.32%) Polycom
8 6 (0.32%) Ruckus Wireless
8 6 (0.32%) Samsung
8 6 (0.32%) Sony
9 5 (0.27%) EMC
9 5 (0.27%) Infor
9 5 (0.27%) Red Hat