Mobile App Jobs

Mobile Application
UK

The table below looks at the prevalence of the term Mobile App in permanent job vacancies. Included is a benchmarking guide to the salaries offered in vacancies that cited Mobile App over the 6 months leading up to 1 April 2025, comparing them to the same period in the previous two years.

6 months to
1 Apr 2025
Same period 2024 Same period 2023
Rank 264 298 201
Rank change year-on-year +34 -97 -73
Permanent jobs citing Mobile App 548 882 2,143
As % of all permanent jobs advertised in the UK 1.09% 0.96% 1.93%
As % of the Miscellaneous category 3.05% 2.67% 4.42%
Number of salaries quoted 423 730 1,190
10th Percentile £36,250 £31,250 £37,500
25th Percentile £45,000 £42,500 £47,500
Median annual salary (50th Percentile) £57,500 £55,000 £62,750
Median % change year-on-year +4.55% -12.35% +0.40%
75th Percentile £72,500 £74,000 £85,000
90th Percentile £90,000 £90,000 £102,500
UK excluding London median annual salary £55,000 £52,500 £55,000
% change year-on-year +4.76% -4.55% -

All Generic Skills
UK

Mobile App falls under the General and Transferable Skills category. For comparison with the information above, the following table provides summary statistics for all permanent job vacancies requiring generic IT skills.

Permanent vacancies with a requirement for generic IT skills 17,978 33,090 48,520
As % of all permanent jobs advertised in the UK 35.61% 35.84% 43.81%
Number of salaries quoted 9,416 22,355 25,085
10th Percentile £32,500 £28,250 £35,500
25th Percentile £45,000 £38,546 £46,250
Median annual salary (50th Percentile) £60,000 £55,000 £65,000
Median % change year-on-year +9.09% -15.38% +4.00%
75th Percentile £80,000 £75,000 £87,500
90th Percentile £111,250 £97,500 £107,500
UK excluding London median annual salary £55,000 £50,000 £55,000
% change year-on-year +10.00% -9.09% +4.76%

Mobile App
Job Vacancy Trend

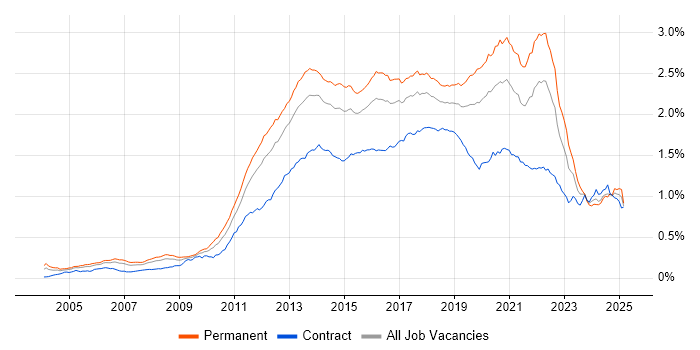
Job postings citing Mobile App as a proportion of all IT jobs advertised.

Job vacancy trend for Mobile App in the UK

Mobile App
Salary Trend

3-month moving average salary quoted in jobs citing Mobile App.

Salary trend for Mobile App in the UK

Mobile App
Salary Histogram

Salary distribution for jobs citing Mobile App over the 6 months to 1 April 2025.

Salary histogram for Mobile App in the UK

Mobile App
Top 15 Job Locations

The table below looks at the demand and provides a guide to the median salaries quoted in IT jobs citing Mobile App within the UK over the 6 months to 1 April 2025. The 'Rank Change' column provides an indication of the change in demand within each location based on the same 6 month period last year.

Location Rank Change
on Same Period
Last Year
Matching
Permanent
IT Job Ads
Median Salary
Past 6 Months
Median Salary
% Change
on Same Period
Last Year
Live
Jobs
England -3 485 £57,500 +7.48% 967
UK excluding London +20 348 £55,000 +4.76% 479
Work from Home +43 243 £60,000 +9.09% 519
London +98 183 £63,000 -6.67% 579
Midlands +9 88 £57,500 +15.00% 73
West Midlands +27 79 £65,000 +23.81% 43
South East +63 78 £47,500 -5.00% 119
North of England +5 69 £45,000 -10.00% 138
Scotland +145 52 £60,000 -20.00% 41
South West +33 32 £60,000 - 48
East of England -1 29 £55,000 - 53
North West -23 29 £60,000 +26.32% 83
Yorkshire +37 26 £28,800 -49.91% 42
North East +31 13 £42,500 - 14
East Midlands +9 9 £43,750 -2.78% 27

Mobile App
Co-occurring Skills and Capabilities by Category

The follow tables expand on the table above by listing co-occurrences grouped by category. The same employment type, locality and period is covered with up to 20 co-occurrences shown in each of the following categories:

Application Platforms
1 18 (3.28%) WordPress
2 16 (2.92%) CMS
2 16 (2.92%) Confluence
3 14 (2.55%) SharePoint
4 12 (2.19%) Drupal
5 7 (1.28%) Microsoft Exchange
6 4 (0.73%) Apache
6 4 (0.73%) nginx
7 3 (0.55%) IIS
7 3 (0.55%) Oracle SOA Suite
7 3 (0.55%) Tomcat
8 2 (0.36%) Headless CMS
8 2 (0.36%) Umbraco
9 1 (0.18%) Appian
9 1 (0.18%) Magnolia
Applications
1 6 (1.09%) Sketch
2 5 (0.91%) Adobe XD
2 5 (0.91%) Microsoft Office
3 4 (0.73%) Microsoft Excel
4 3 (0.55%) Adobe Creative Suite
4 3 (0.55%) Notion
5 2 (0.36%) AutoCAD
5 2 (0.36%) Revit
6 1 (0.18%) Chatbot
6 1 (0.18%) InVision
6 1 (0.18%) Microsoft PowerPoint
6 1 (0.18%) Trello
Business Applications
1 6 (1.09%) Dynamics CRM
2 1 (0.18%) Magento
2 1 (0.18%) Payment Gateway
2 1 (0.18%) Sage 200
2 1 (0.18%) Shopify
Cloud Services
1 139 (25.36%) AWS
2 106 (19.34%) Azure
3 59 (10.77%) GCP
4 35 (6.39%) SaaS
5 34 (6.20%) Azure DevOps
6 27 (4.93%) GitHub
7 24 (4.38%) Power Platform
8 23 (4.20%) Figma
9 15 (2.74%) Serverless
10 14 (2.55%) Firebase
10 14 (2.55%) Microsoft 365
11 11 (2.01%) GitHub Actions
12 10 (1.82%) Amazon S3
13 8 (1.46%) AWS Lambda
13 8 (1.46%) Cloud Computing
13 8 (1.46%) DigitalOcean
13 8 (1.46%) PowerApps
14 7 (1.28%) BrowserStack
14 7 (1.28%) Dynamics 365
15 6 (1.09%) Sauce Labs
Communications & Networking
1 17 (3.10%) Internet
2 9 (1.64%) Bluetooth
2 9 (1.64%) Wireless
3 8 (1.46%) HTTP
4 6 (1.09%) Wi-Fi
5 3 (0.55%) Remote Desktop
5 3 (0.55%) TCP/IP
6 2 (0.36%) HTTPS
6 2 (0.36%) Network Security
6 2 (0.36%) VPN
7 1 (0.18%) 5G
7 1 (0.18%) DNS
7 1 (0.18%) Firewall
7 1 (0.18%) X.21
Database & Business Intelligence
1 65 (11.86%) MySQL
2 59 (10.77%) SQL Server
3 25 (4.56%) SQL Server Reporting Services
4 24 (4.38%) PostgreSQL
5 15 (2.74%) NoSQL
6 12 (2.19%) Power BI
7 8 (1.46%) Big Data
8 7 (1.28%) MariaDB
9 6 (1.09%) Elasticsearch
10 5 (0.91%) BigQuery
10 5 (0.91%) GIS
11 4 (0.73%) Cloud Spanner
11 4 (0.73%) Event Store
12 3 (0.55%) Amazon RDS
12 3 (0.55%) Relational Database
13 2 (0.36%) Data Mining
13 2 (0.36%) Redis
14 1 (0.18%) Hadoop
14 1 (0.18%) RDBMS
14 1 (0.18%) Tableau
Development Applications
1 117 (21.35%) Git
2 30 (5.47%) Visual Studio
3 28 (5.11%) JIRA
4 26 (4.74%) Appium
5 25 (4.56%) Jenkins
6 18 (3.28%) JUnit
7 14 (2.55%) GitLab
7 14 (2.55%) Selenium
8 13 (2.37%) Gradle
9 12 (2.19%) TestNG
10 11 (2.01%) Maven
11 10 (1.82%) Xcode
12 9 (1.64%) Android Studio
13 8 (1.46%) SonarQube
14 7 (1.28%) Cucumber
15 5 (0.91%) Bitbucket
15 5 (0.91%) Octopus Deploy
15 5 (0.91%) WebDriver
15 5 (0.91%) XCUITest
16 4 (0.73%) Browser DevTools
General
1 121 (22.08%) Social Skills
2 103 (18.80%) Finance
3 78 (14.23%) Games
4 47 (8.58%) Analytical Skills
5 44 (8.03%) Marketing
6 43 (7.85%) Banking
7 34 (6.20%) Legal
8 31 (5.66%) Inclusion and Diversity
9 27 (4.93%) Retail
10 16 (2.92%) Law
11 14 (2.55%) Presentation Skills
12 13 (2.37%) Aviation
13 11 (2.01%) Organisational Skills
14 10 (1.82%) Automotive
15 8 (1.46%) Investment Banking
15 8 (1.46%) Local Government
16 7 (1.28%) Influencing Skills
16 7 (1.28%) Public Sector
16 7 (1.28%) Telecoms
17 6 (1.09%) Publishing
Job Titles
1 235 (42.88%) Developer
2 141 (25.73%) Senior
3 87 (15.88%) Senior Developer
4 68 (12.41%) Lead
5 49 (8.94%) Software Engineer
6 37 (6.75%) Analyst
7 32 (5.84%) iOS Developer
8 25 (4.56%) Android Engineer
8 25 (4.56%) Portal Developer
9 23 (4.20%) React Developer
9 23 (4.20%) Xamarin Developer
10 22 (4.01%) PHP Developer
10 22 (4.01%) Senior Xamarin Developer
11 20 (3.65%) Android Developer
11 20 (3.65%) Lead Developer
12 19 (3.47%) Graduate
13 17 (3.10%) Senior PHP Developer
13 17 (3.10%) Senior Software Engineer
13 17 (3.10%) Tester
14 16 (2.92%) Applications Developer
Libraries, Frameworks & Software Standards
1 108 (19.71%) CSS
1 108 (19.71%) HTML
2 105 (19.16%) React
3 103 (18.80%) .NET
4 59 (10.77%) RESTful
5 51 (9.31%) React Native
6 49 (8.94%) .NET Core
7 47 (8.58%) Laravel
8 45 (8.21%) .NET Framework
9 41 (7.48%) JSON
10 39 (7.12%) LAMP
11 35 (6.39%) REST
12 32 (5.84%) XML
13 28 (5.11%) ASP.NET
14 25 (4.56%) Flutter
14 25 (4.56%) Node.js
15 24 (4.38%) GraphQL
16 22 (4.01%) MvvmCross
17 21 (3.83%) HTML5
18 19 (3.47%) Django
Miscellaneous
1 27 (4.93%) Greenfield Project
1 27 (4.93%) Self-Motivation
2 25 (4.56%) Product Ownership
3 17 (3.10%) Hackathon
3 17 (3.10%) Learning Management System
4 15 (2.74%) Legacy Systems
5 14 (2.55%) IoT
5 14 (2.55%) Mobile Games
6 13 (2.37%) Onboarding
7 12 (2.19%) Online Banking
8 11 (2.01%) Algorithms
8 11 (2.01%) Cloud Native
8 11 (2.01%) Virtual Team
9 10 (1.82%) EPoS
10 8 (1.46%) Foreign Exchange (FX)
11 7 (1.28%) Embedded Systems
11 7 (1.28%) Enterprise Software
12 6 (1.09%) Client/Server
12 6 (1.09%) Educational Technology
13 5 (0.91%) Management Information System
Operating Systems
1 160 (29.20%) Android
2 151 (27.55%) Apple iOS
3 32 (5.84%) Windows
4 26 (4.74%) Linux
5 10 (1.82%) Windows Server
6 7 (1.28%) Ubuntu
7 4 (0.73%) VMS
8 3 (0.55%) Rocky
8 3 (0.55%) Windows 10
9 1 (0.18%) Debian
9 1 (0.18%) Unix
9 1 (0.18%) Windows Phone
9 1 (0.18%) Windows Phone 7
Processes & Methodologies
1 186 (33.94%) Agile
2 120 (21.90%) Problem-Solving
2 120 (21.90%) Software Engineering
3 107 (19.53%) CI/CD
4 99 (18.07%) DevOps
5 98 (17.88%) Mobile Application Development
6 97 (17.70%) User Experience
7 86 (15.69%) E-Commerce
8 74 (13.50%) Test Automation
9 68 (12.41%) Web Development
10 62 (11.31%) OOP
11 59 (10.77%) MVC
12 58 (10.58%) iOS Development
13 57 (10.40%) Mobile Development
14 56 (10.22%) Computer Science
15 53 (9.67%) Android Development
16 50 (9.12%) Full-Stack Development
17 45 (8.21%) Analytics
18 44 (8.03%) Software Testing
19 43 (7.85%) Unit Testing
Programming Languages
1 190 (34.67%) JavaScript
2 95 (17.34%) C#
3 78 (14.23%) Kotlin
4 75 (13.69%) SQL
5 70 (12.77%) Java
6 68 (12.41%) Python
7 63 (11.50%) Swift
8 60 (10.95%) TypeScript
9 51 (9.31%) PHP
10 22 (4.01%) Objective-C
11 13 (2.37%) C++
12 11 (2.01%) C
13 10 (1.82%) Dart
14 6 (1.09%) Ladder Logic
15 5 (0.91%) Go
15 5 (0.91%) Ruby
16 4 (0.73%) PowerShell
17 3 (0.55%) T-SQL
18 1 (0.18%) Rust
18 1 (0.18%) XAML
Qualifications
1 89 (16.24%) Degree
2 49 (8.94%) Computer Science Degree
3 20 (3.65%) Master's Degree
4 17 (3.10%) PhD
5 9 (1.64%) CHECK Team Leader
5 9 (1.64%) CREST Certified
6 6 (1.09%) Security Cleared
7 4 (0.73%) ACCA
7 4 (0.73%) CHECK Team Member
7 4 (0.73%) CIMA
7 4 (0.73%) DV Cleared
7 4 (0.73%) OSCP
8 3 (0.55%) ISTQB
8 3 (0.55%) SC Cleared
9 2 (0.36%) CISSP
9 2 (0.36%) CSSLP
9 2 (0.36%) ISTQB Advanced Certification
10 1 (0.18%) MBA
10 1 (0.18%) Microsoft Certification
10 1 (0.18%) PMI Certification
Quality Assurance & Compliance
1 57 (10.40%) QA
2 16 (2.92%) Accessibility
3 7 (1.28%) ISO/IEC 27001
4 6 (1.09%) NIST
5 4 (0.73%) Actionable Recommendations
5 4 (0.73%) Cyber Essentials
5 4 (0.73%) Cyber Essentials PLUS
5 4 (0.73%) GRC
5 4 (0.73%) PCI DSS
5 4 (0.73%) WCAG
6 3 (0.55%) Data Quality
System Software
1 26 (4.74%) Docker
2 22 (4.01%) Active Directory
3 3 (0.55%) LXC
3 3 (0.55%) Virtual Servers
3 3 (0.55%) VMware Infrastructure
4 1 (0.18%) Embedded Firmware
4 1 (0.18%) Firmware
4 1 (0.18%) Hyper-V
4 1 (0.18%) Virtual Desktop
4 1 (0.18%) Virtual Machines
Systems Management
1 21 (3.83%) Kubernetes
2 13 (2.37%) Terraform
3 9 (1.64%) Microsoft Intune
4 7 (1.28%) AirWatch
4 7 (1.28%) SCCM
5 4 (0.73%) Single Sign-On
6 2 (0.36%) Active Directory Federation Services
6 2 (0.36%) Grafana
6 2 (0.36%) Prometheus
6 2 (0.36%) Puppet
7 1 (0.18%) Ansible
7 1 (0.18%) Rundeck
Vendors
1 90 (16.42%) Microsoft
2 45 (8.21%) Google
3 25 (4.56%) Xamarin
4 17 (3.10%) IBM
5 14 (2.55%) New Relic
6 13 (2.37%) ServiceNow
6 13 (2.37%) Twitter
7 11 (2.01%) Apple
8 9 (1.64%) Adobe
8 9 (1.64%) Zoho
9 7 (1.28%) Oracle
9 7 (1.28%) Samsung
10 6 (1.09%) Siemens
11 4 (0.73%) iManage
11 4 (0.73%) Optimizely
12 3 (0.55%) Citrix
12 3 (0.55%) Intapp
12 3 (0.55%) Red Hat
12 3 (0.55%) Salesforce
12 3 (0.55%) VMware