Project Delivery Jobs

Project Delivery
UK

The table below provides summary statistics for permanent job vacancies requiring Project Delivery skills. It includes a benchmarking guide to the annual salaries offered in vacancies that cited Project Delivery over the 6 months leading up to 11 May 2025, comparing them to the same period in the previous two years.

6 months to
11 May 2025
Same period 2024 Same period 2023
Rank 69 63 73
Rank change year-on-year -6 +10 +12
Permanent jobs citing Project Delivery 2,028 3,798 4,253
As % of all permanent jobs advertised in the UK 3.71% 3.83% 4.21%
As % of the Processes & Methodologies category 3.95% 4.47% 4.40%
Number of salaries quoted 1,339 2,661 2,640
10th Percentile £38,754 £36,250 £41,250
25th Percentile £50,000 £45,000 £50,000
Median annual salary (50th Percentile) £60,000 £55,000 £61,180
Median % change year-on-year +9.09% -10.10% +1.97%
75th Percentile £76,250 £72,500 £77,500
90th Percentile £96,450 £87,000 £90,000
UK excluding London median annual salary £57,500 £52,500 £59,526
% change year-on-year +9.52% -11.80% +13.38%

All Process and Methodology Skills
UK

Project Delivery falls under the Processes and Methodologies category. For comparison with the information above, the following table provides summary statistics for all permanent job vacancies requiring process or methodology skills.

Permanent vacancies with a requirement for process or methodology skills 51,302 84,920 96,579
As % of all permanent jobs advertised in the UK 93.76% 85.59% 95.61%
Number of salaries quoted 27,015 59,883 56,845
10th Percentile £30,000 £29,008 £34,000
25th Percentile £42,500 £40,000 £45,000
Median annual salary (50th Percentile) £57,500 £55,000 £61,180
Median % change year-on-year +4.55% -10.10% +1.97%
75th Percentile £75,000 £72,500 £81,250
90th Percentile £98,474 £92,500 £100,000
UK excluding London median annual salary £52,500 £50,000 £55,000
% change year-on-year +5.00% -9.09% +4.76%

Project Delivery
Job Vacancy Trend

Job postings citing Project Delivery as a proportion of all IT jobs advertised.
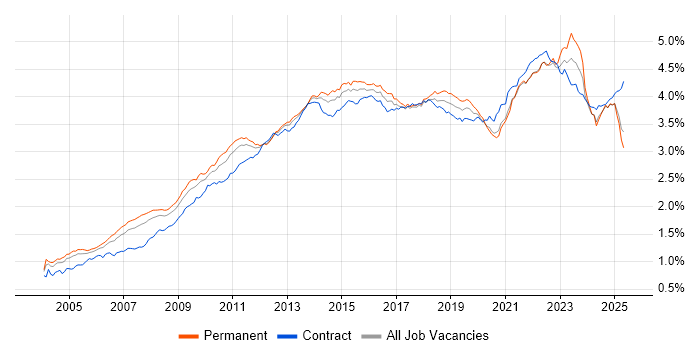
Job vacancy trend for Project Delivery in the UK

Project Delivery
Salary Trend

3-month moving average salary quoted in jobs citing Project Delivery.

Salary trend for Project Delivery in the UK

Project Delivery
Salary Histogram

Salary distribution for jobs citing Project Delivery over the 6 months to 11 May 2025.

Salary histogram for Project Delivery in the UK

Project Delivery
Top 18 Job Locations

The table below looks at the demand and provides a guide to the median salaries quoted in IT jobs citing Project Delivery within the UK over the 6 months to 11 May 2025. The 'Rank Change' column provides an indication of the change in demand within each location based on the same 6 month period last year.

Location Rank Change
on Same Period
Last Year
Matching
Permanent
IT Job Ads
Median Salary
Past 6 Months
Median Salary
% Change
on Same Period
Last Year
Live
Jobs
England -12 1,843 £60,000 +9.09% 2,046
UK excluding London -3 1,422 £57,500 +9.52% 1,402
Work from Home -32 583 £64,000 +6.67% 1,095
North of England 0 527 £56,000 +12.00% 301
London -17 471 £77,500 +10.71% 947
North West +11 465 £56,000 +12.00% 180
South East -2 388 £60,000 +15.94% 482
Midlands -28 234 £55,000 +1.85% 194
West Midlands -8 183 £55,000 -4.35% 113
South West -38 109 £56,745 +3.17% 167
East of England -56 75 £50,000 -7.41% 140
Scotland +27 49 £60,000 +20.00% 109
Yorkshire -38 49 £57,500 +9.52% 89
East Midlands -50 49 £53,250 -1.39% 71
Wales 0 24 £64,000 +5.79% 29
Northern Ireland +42 15 £40,221 - 29
North East -16 13 £46,250 -7.96% 37
Channel Islands +4 4 £87,500 -

Project Delivery
Co-occurring Skills and Capabilities by Category

The follow tables expand on the table above by listing co-occurrences grouped by category. The same employment type, locality and period is covered with up to 20 co-occurrences shown in each of the following categories:

Application Platforms
1 55 (2.71%) SharePoint
2 34 (1.68%) Confluence
3 24 (1.18%) Microsoft Exchange
4 19 (0.94%) IIS
5 14 (0.69%) CMS
6 10 (0.49%) Kentico
7 8 (0.39%) Apache
8 5 (0.25%) WordPress
9 4 (0.20%) Apache Spark
9 4 (0.20%) Oracle SOA Suite
9 4 (0.20%) SAP Portal
10 2 (0.099%) Apache Airflow
10 2 (0.099%) ArcGIS
10 2 (0.099%) SAS
10 2 (0.099%) SharePoint Server
10 2 (0.099%) ThingWorx
10 2 (0.099%) Umbraco
11 1 (0.049%) Drupal
11 1 (0.049%) Sitefinity
11 1 (0.049%) Skype for Business
Applications
1 134 (6.61%) Microsoft Project
2 131 (6.46%) Microsoft Office
3 101 (4.98%) Microsoft Excel
4 75 (3.70%) Microsoft PowerPoint
5 31 (1.53%) MS Visio
6 28 (1.38%) Trello
7 12 (0.59%) AutoCAD
7 12 (0.59%) Maya
8 7 (0.35%) ProjectWise
9 5 (0.25%) Adobe XD
10 4 (0.20%) Spreadsheet
11 3 (0.15%) Adobe Premiere
11 3 (0.15%) Final Cut Pro
11 3 (0.15%) Revit
12 2 (0.099%) Chatbot
12 2 (0.099%) Simulink
12 2 (0.099%) Zemax
13 1 (0.049%) Blender
Business Applications
1 41 (2.02%) Dynamics CRM
2 35 (1.73%) SAP S/4HANA
3 11 (0.54%) Aladdin
4 8 (0.39%) SAP IBP
5 7 (0.35%) Oracle ERP
5 7 (0.35%) Salesforce CRM
6 6 (0.30%) Oracle EBS
7 5 (0.25%) SAP HR
8 4 (0.20%) Elite 3E
8 4 (0.20%) Magento
8 4 (0.20%) NetSuite
8 4 (0.20%) SAP ERP
8 4 (0.20%) Sparx Enterprise Architect
8 4 (0.20%) Teamcenter
9 3 (0.15%) Dynamics NAV
9 3 (0.15%) Orchestrade
9 3 (0.15%) SAP BPC
9 3 (0.15%) SAP CO
9 3 (0.15%) SAP FI
9 3 (0.15%) Shopify
Cloud Services
1 297 (14.64%) Azure
2 157 (7.74%) Power Platform
3 154 (7.59%) Microsoft 365
4 126 (6.21%) AWS
5 88 (4.34%) SaaS
6 60 (2.96%) GCP
7 56 (2.76%) Dynamics 365
8 30 (1.48%) Azure DevOps
9 22 (1.08%) PaaS
10 19 (0.94%) Entra ID
11 18 (0.89%) Snowflake
12 17 (0.84%) IaaS
13 16 (0.79%) Cloud Computing
13 16 (0.79%) PowerApps
13 16 (0.79%) Serverless
14 15 (0.74%) Microsoft Copilot
14 15 (0.74%) Smartsheet
15 12 (0.59%) dbt
16 11 (0.54%) Azure Sentinel
16 11 (0.54%) Power Automate
Communications & Networking
1 81 (3.99%) Firewall
2 43 (2.12%) WAN
3 38 (1.87%) VPN
4 37 (1.82%) DNS
5 30 (1.48%) Network Security
6 28 (1.38%) LAN
6 28 (1.38%) VLAN
7 25 (1.23%) DHCP
8 23 (1.13%) Wireless
9 22 (1.08%) SD-WAN
10 21 (1.04%) TCP/IP
11 20 (0.99%) VoIP
12 18 (0.89%) BGP
12 18 (0.89%) Intrusion Detection
12 18 (0.89%) OSPF
13 12 (0.59%) MPLS
14 9 (0.44%) Cisco Firepower
15 8 (0.39%) 5G
15 8 (0.39%) WLAN
16 7 (0.35%) Cisco ISE
Database & Business Intelligence
1 107 (5.28%) Power BI
2 63 (3.11%) SQL Server
3 29 (1.43%) Data Warehouse
4 26 (1.28%) Data Lake
5 18 (0.89%) Relational Database
6 15 (0.74%) GIS
7 13 (0.64%) Azure SQL Database
7 13 (0.64%) SAP BW
8 12 (0.59%) SAP HANA
9 9 (0.44%) Big Data
9 9 (0.44%) Electronic Patient Records
9 9 (0.44%) Hadoop
9 9 (0.44%) QlikView
10 8 (0.39%) DB2
10 8 (0.39%) MySQL
10 8 (0.39%) Tableau
11 7 (0.35%) Amazon RDS
11 7 (0.35%) MongoDB
11 7 (0.35%) PostgreSQL
12 6 (0.30%) Microsoft Analysis Services
Development Applications
1 124 (6.11%) JIRA
2 29 (1.43%) Git
3 9 (0.44%) Rational DOORS
4 8 (0.39%) GitLab
5 5 (0.25%) Axure RP
5 5 (0.25%) Balsamiq
6 4 (0.20%) Subversion
7 3 (0.15%) Jenkins
7 3 (0.15%) Selenium
8 2 (0.099%) LSMW
8 2 (0.099%) Oracle APEX
8 2 (0.099%) Oracle Forms
8 2 (0.099%) Visual Studio Code
9 1 (0.049%) Android Studio
9 1 (0.049%) Babel
9 1 (0.049%) gcov
9 1 (0.049%) Postman
9 1 (0.049%) SQL Server Management Studio (SSMS)
9 1 (0.049%) VersaTest
9 1 (0.049%) webpack
General
1 819 (40.38%) Social Skills
2 597 (29.44%) Finance
3 276 (13.61%) Analytical Skills
4 205 (10.11%) Manufacturing
5 182 (8.97%) Inclusion and Diversity
6 163 (8.04%) Public Sector
7 140 (6.90%) Organisational Skills
8 122 (6.02%) Marketing
9 117 (5.77%) Retail
10 105 (5.18%) Legal
11 104 (5.13%) Law
12 93 (4.59%) Telecoms
13 72 (3.55%) Presentation Skills
14 64 (3.16%) Electronics
15 62 (3.06%) Banking
16 61 (3.01%) Influencing Skills
17 37 (1.82%) Local Government
18 32 (1.58%) Aerospace
19 28 (1.38%) Games
20 26 (1.28%) Pharmaceutical
Job Titles
1 588 (28.99%) Project Manager
2 290 (14.30%) Senior
3 209 (10.31%) Lead
4 194 (9.57%) Analyst
5 186 (9.17%) Delivery Project Manager
6 122 (6.02%) IT Manager
7 105 (5.18%) Senior Manager
8 86 (4.24%) Architect
9 85 (4.19%) Delivery Manager
10 77 (3.80%) Consultant
11 71 (3.50%) Senior Project Manager
12 68 (3.35%) Developer
13 57 (2.81%) IT Project Manager
14 56 (2.76%) Digital Analyst
15 53 (2.61%) Engineering Manager
16 51 (2.51%) Project Leader
17 47 (2.32%) Business Analyst
18 42 (2.07%) Assistant Project Manager
19 37 (1.82%) Project Engineer
20 34 (1.68%) IT Support
Libraries, Frameworks & Software Standards
1 38 (1.87%) .NET
2 33 (1.63%) HTML
3 21 (1.04%) AngularJS
3 21 (1.04%) CSS
4 17 (0.84%) React
4 17 (0.84%) REST
5 16 (0.79%) Middleware
6 12 (0.59%) Web Services
7 11 (0.54%) JSON
7 11 (0.54%) Kafka
8 10 (0.49%) RESTful
8 10 (0.49%) scikit-learn
9 9 (0.44%) PyTorch
10 8 (0.39%) Node.js
10 8 (0.39%) TensorFlow
11 7 (0.35%) .NET Core
11 7 (0.35%) HTML5
11 7 (0.35%) jQuery
11 7 (0.35%) Vue
12 6 (0.30%) Pixi.js
Miscellaneous
1 75 (3.70%) Management Information System
2 74 (3.65%) Onboarding
3 64 (3.16%) Product Ownership
4 59 (2.91%) Data Centre
5 51 (2.51%) Self-Motivation
6 44 (2.17%) Driving Licence
7 43 (2.12%) PMI
8 37 (1.82%) Enterprise Software
9 36 (1.78%) Robotics
10 33 (1.63%) Social Media
11 32 (1.58%) Blockchain
12 28 (1.38%) Analytical Mindset
13 24 (1.18%) NHS
13 24 (1.18%) Virtual Team
14 18 (0.89%) Cyberattack
15 17 (0.84%) Public Cloud
16 16 (0.79%) Greenfield Project
16 16 (0.79%) IoT
16 16 (0.79%) Renewable Energy
16 16 (0.79%) SCADA
Operating Systems
1 124 (6.11%) Windows
2 76 (3.75%) Windows Server
3 26 (1.28%) Linux
4 21 (1.04%) Windows 10
5 17 (0.84%) Windows Server 2019
6 12 (0.59%) Windows Server 2016
7 10 (0.49%) Windows Vista
8 9 (0.44%) Mac OS
8 9 (0.44%) Windows Server 2012
9 8 (0.39%) Red Hat Enterprise Linux
9 8 (0.39%) Unix
10 7 (0.35%) Android
11 5 (0.25%) Windows Server 2008
12 4 (0.20%) AIX
12 4 (0.20%) Apple iOS
13 2 (0.099%) VMS
14 1 (0.049%) Debian
14 1 (0.049%) Ubuntu
14 1 (0.049%) Windows Server 2003
14 1 (0.049%) zOS
Processes & Methodologies
1 1,017 (50.15%) Project Management
2 577 (28.45%) Agile
3 490 (24.16%) Stakeholder Management
4 402 (19.82%) Problem-Solving
5 316 (15.58%) Continuous Improvement
6 283 (13.95%) Mentoring
7 259 (12.77%) PRINCE2
8 253 (12.48%) Risk Management
9 220 (10.85%) Analytics
10 185 (9.12%) Business Case
11 176 (8.68%) Roadmaps
12 172 (8.48%) Change Management
13 163 (8.04%) Artificial Intelligence
13 163 (8.04%) Waterfall
14 155 (7.64%) Business Intelligence
15 144 (7.10%) Cybersecurity
16 139 (6.85%) Collaborative Working
16 139 (6.85%) Service Delivery
17 137 (6.76%) Coaching
18 131 (6.46%) ITIL
Programming Languages
1 152 (7.50%) SQL
2 88 (4.34%) Python
3 55 (2.71%) PowerShell
4 51 (2.51%) C#
5 34 (1.68%) JavaScript
6 27 (1.33%) Java
7 17 (0.84%) C++
8 15 (0.74%) R
9 14 (0.69%) C
10 12 (0.59%) ABAP
11 10 (0.49%) Data Analysis Expressions
12 9 (0.44%) Bash
12 9 (0.44%) PHP
13 8 (0.39%) TypeScript
14 6 (0.30%) MATLAB
15 5 (0.25%) T-SQL
16 4 (0.20%) VBA
17 3 (0.15%) Kotlin
18 2 (0.099%) SOQL
18 2 (0.099%) Swift
Qualifications
1 529 (26.08%) Degree
2 319 (15.73%) BPSS Clearance
3 174 (8.58%) Security Cleared
4 126 (6.21%) PMI Certification
5 91 (4.49%) PMP
6 69 (3.40%) HNC
7 61 (3.01%) SC Cleared
8 58 (2.86%) DBS Check
9 53 (2.61%) DV Cleared
10 47 (2.32%) Computer Science Degree
10 47 (2.32%) HND
11 41 (2.02%) Chartered Engineer
12 37 (1.82%) Azure Certification
13 36 (1.78%) CISSP
14 32 (1.58%) Master's Degree
15 31 (1.53%) Cisco Certification
16 28 (1.38%) Microsoft Certification
17 26 (1.28%) Six Sigma Black Belt
18 24 (1.18%) Six Sigma Green Belt
19 22 (1.08%) PRINCE2 Practitioner
Quality Assurance & Compliance
1 135 (6.66%) QA
2 74 (3.65%) PMO
3 39 (1.92%) Data Quality
4 34 (1.68%) GDPR
4 34 (1.68%) ISO/IEC 27001
5 33 (1.63%) Accessibility
6 24 (1.18%) Cyber Essentials
7 21 (1.04%) ITGC
8 18 (0.89%) PMBOK
9 14 (0.69%) SLA
10 13 (0.64%) Cyber Essentials PLUS
11 12 (0.59%) GxP
12 11 (0.54%) Sarbanes-Oxley
13 9 (0.44%) ISO 9001
14 6 (0.30%) NIST
14 6 (0.30%) WCAG
15 4 (0.20%) Def Stans
15 4 (0.20%) GMP
15 4 (0.20%) MiFID
16 3 (0.15%) IEC 61508
System Software
1 64 (3.16%) Active Directory
2 51 (2.51%) VMware Infrastructure
3 29 (1.43%) Docker
3 29 (1.43%) Hyper-V
4 11 (0.54%) Virtual Desktop
5 8 (0.39%) VMware ESXi
6 7 (0.35%) vSphere
7 6 (0.30%) Virtual Machines
8 1 (0.049%) BitLocker
8 1 (0.049%) Firmware
8 1 (0.049%) Job Entry Subsystem
8 1 (0.049%) Microsoft App-V
8 1 (0.049%) Time Sharing Option
8 1 (0.049%) Virtual Servers
8 1 (0.049%) VMware Server
8 1 (0.049%) VMware Workstation
8 1 (0.049%) XenApp
Systems Management
1 55 (2.71%) Microsoft Intune
2 30 (1.48%) Kubernetes
3 14 (0.69%) FortiGate
3 14 (0.69%) Terraform
4 13 (0.64%) Ansible
4 13 (0.64%) SCCM
5 6 (0.30%) Single Sign-On
6 5 (0.25%) WSUS
6 5 (0.25%) ZABBIX
7 4 (0.20%) vCenter Server
8 3 (0.15%) Functional Safety
8 3 (0.15%) Progress Chef
9 2 (0.099%) Marathon
10 1 (0.049%) Active Directory Federation Services
10 1 (0.049%) Amdocs OSS
10 1 (0.049%) Failover Clustering
10 1 (0.049%) Jamf Pro
10 1 (0.049%) Packer
10 1 (0.049%) SCOrch
10 1 (0.049%) SCSM
Vendors
1 356 (17.55%) Microsoft
2 158 (7.79%) SAP
3 80 (3.94%) VMware
4 71 (3.50%) Salesforce
5 57 (2.81%) Alteryx
6 55 (2.71%) Cisco
7 42 (2.07%) Oracle
8 39 (1.92%) Google
9 32 (1.58%) Databricks
10 25 (1.23%) ServiceNow
11 24 (1.18%) Meraki
12 22 (1.08%) Atlassian
13 20 (0.99%) Fortinet
14 19 (0.94%) NEC
14 19 (0.94%) Veeam
15 18 (0.89%) Adobe
15 18 (0.89%) Juniper
16 17 (0.84%) IBM
17 12 (0.59%) Facebook
17 12 (0.59%) YouTube