Software Engineering Jobs

Software Engineering
UK

The table below provides summary statistics for permanent job vacancies requiring Software Engineering skills. It includes a benchmarking guide to the annual salaries offered in vacancies that cited Software Engineering over the 6 months leading up to 9 May 2025, comparing them to the same period in the previous two years.

6 months to
9 May 2025
Same period 2024 Same period 2023
Rank 16 11 17
Rank change year-on-year -5 +6 -6
Permanent jobs citing Software Engineering 5,050 11,640 11,082
As % of all permanent jobs advertised in the UK 9.32% 11.75% 10.94%
As % of the Processes & Methodologies category 9.94% 13.72% 11.44%
Number of salaries quoted 3,439 7,216 6,675
10th Percentile £43,750 £40,000 £42,500
25th Percentile £52,600 £47,500 £53,750
Median annual salary (50th Percentile) £65,000 £62,500 £70,000
Median % change year-on-year +4.00% -10.71% -
75th Percentile £95,000 £84,241 £93,750
90th Percentile £120,000 £110,625 £116,250
UK excluding London median annual salary £58,033 £57,500 £61,500
% change year-on-year +0.93% -6.50% +6.96%

All Process and Methodology Skills
UK

Software Engineering falls under the Processes and Methodologies category. For comparison with the information above, the following table provides summary statistics for all permanent job vacancies requiring process or methodology skills.

Permanent vacancies with a requirement for process or methodology skills 50,790 84,812 96,895
As % of all permanent jobs advertised in the UK 93.76% 85.58% 95.62%
Number of salaries quoted 26,810 59,843 56,946
10th Percentile £30,000 £29,000 £34,000
25th Percentile £42,500 £40,000 £45,000
Median annual salary (50th Percentile) £57,500 £55,000 £61,180
Median % change year-on-year +4.55% -10.10% +1.97%
75th Percentile £75,000 £72,500 £81,250
90th Percentile £98,474 £92,500 £100,000
UK excluding London median annual salary £52,500 £50,000 £55,000
% change year-on-year +5.00% -9.09% +4.76%

Software Engineering
Job Vacancy Trend

Job postings citing Software Engineering as a proportion of all IT jobs advertised.
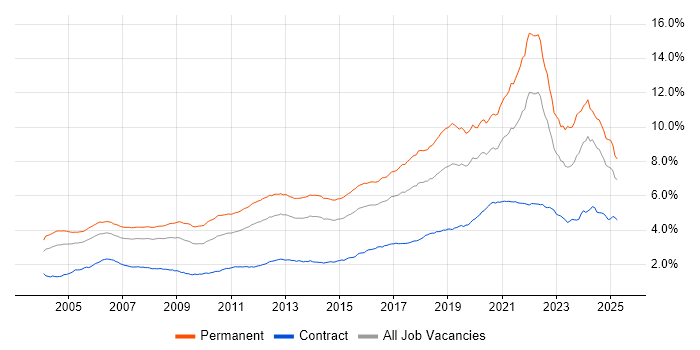
Job vacancy trend for Software Engineering in the UK

Software Engineering
Salary Trend

3-month moving average salary quoted in jobs citing Software Engineering.

Salary trend for Software Engineering in the UK

Software Engineering
Salary Histogram

Salary distribution for jobs citing Software Engineering over the 6 months to 9 May 2025.

Salary histogram for Software Engineering in the UK

Software Engineering
Top 17 Job Locations

The table below looks at the demand and provides a guide to the median salaries quoted in IT jobs citing Software Engineering within the UK over the 6 months to 9 May 2025. The 'Rank Change' column provides an indication of the change in demand within each location based on the same 6 month period last year.

Location Rank Change
on Same Period
Last Year
Matching
Permanent
IT Job Ads
Median Salary
Past 6 Months
Median Salary
% Change
on Same Period
Last Year
Live
Jobs
England -3 4,254 £67,500 +8.00% 4,826
UK excluding London -4 3,588 £58,033 +0.93% 3,279
Work from Home -1 2,168 £74,870 +15.18% 2,778
London -4 1,288 £100,000 +9.29% 2,395
North of England +2 1,059 £57,836 -3.61% 776
North West -5 757 £55,000 -8.33% 448
South East -10 601 £65,000 +13.04% 1,084
Scotland -4 596 £58,033 -3.28% 241
Midlands -7 497 £62,500 +13.64% 352
South West 0 491 £53,230 -3.22% 393
West Midlands -6 301 £65,000 +8.33% 199
East of England -24 253 £62,500 +4.17% 408
Yorkshire -7 227 £67,500 +22.73% 219
East Midlands -6 196 £60,000 +20.00% 141
Wales -5 78 £65,000 +30.00% 55
North East +9 75 £55,000 - 115
Northern Ireland -13 15 £90,000 +50.00% 64

Software Engineering
Co-occurring Skills and Capabilities by Category

The follow tables expand on the table above by listing co-occurrences grouped by category. The same employment type, locality and period is covered with up to 20 co-occurrences shown in each of the following categories:

Application Platforms
1 285 (5.64%) Apache Airflow
2 237 (4.69%) Apache
3 218 (4.32%) Confluence
4 115 (2.28%) Apache Spark
5 23 (0.46%) Jupyter
6 19 (0.38%) SharePoint
7 18 (0.36%) CMS
8 13 (0.26%) Kinematics
9 12 (0.24%) Microsoft Exchange
10 7 (0.14%) CICS
10 7 (0.14%) IIS
11 6 (0.12%) Headless CMS
12 5 (0.099%) Liferay
12 5 (0.099%) OpenStack
13 3 (0.059%) Adobe Experience Manager
13 3 (0.059%) NServiceBus
13 3 (0.059%) Solana
14 2 (0.040%) Ethereum
14 2 (0.040%) nginx
14 2 (0.040%) Sitefinity
Applications
1 581 (11.50%) Simulink
2 61 (1.21%) Chatbot
3 17 (0.34%) Microsoft Excel
4 10 (0.20%) Microsoft Office
5 4 (0.079%) Adobe XD
5 4 (0.079%) Microsoft Project
5 4 (0.079%) Sketch
6 3 (0.059%) Trello
7 2 (0.040%) Blender
7 2 (0.040%) Maya
7 2 (0.040%) Microsoft PowerPoint
8 1 (0.020%) Adobe Creative Suite
8 1 (0.020%) AutoCAD
8 1 (0.020%) CANalyzer
8 1 (0.020%) GNU Octave
8 1 (0.020%) OrCAD
8 1 (0.020%) Revit
8 1 (0.020%) S-PLUS
Business Applications
1 11 (0.22%) Dynamics CRM
2 10 (0.20%) Shopify
3 8 (0.16%) NetSuite
4 6 (0.12%) Magento
5 5 (0.099%) Q-Pulse
6 4 (0.079%) Payment Gateway
6 4 (0.079%) Remedy ITSM
7 2 (0.040%) Endur
7 2 (0.040%) Oracle BPM
7 2 (0.040%) Oracle Subledger Accounting
7 2 (0.040%) Refinitiv Enterprise Platform
7 2 (0.040%) ResourceLink
8 1 (0.020%) BASE24
8 1 (0.020%) Elite 3E
8 1 (0.020%) iTrent
8 1 (0.020%) LabWindows
8 1 (0.020%) Oracle ERP
8 1 (0.020%) RMDS
8 1 (0.020%) Salesforce CRM
8 1 (0.020%) SAP Hybris
Cloud Services
1 1,681 (33.29%) AWS
2 1,196 (23.68%) Azure
3 828 (16.40%) GCP
4 284 (5.62%) dbt
5 269 (5.33%) Serverless
6 201 (3.98%) SaaS
7 197 (3.90%) AWS Lambda
8 179 (3.54%) GitHub
9 153 (3.03%) Amazon ECS
10 138 (2.73%) Azure DevOps
11 134 (2.65%) Snowflake
12 126 (2.50%) Amazon EKS
13 115 (2.28%) Amazon EC2
14 114 (2.26%) AWS CloudFormation
15 110 (2.18%) Amazon S3
16 90 (1.78%) OpenShift
17 84 (1.66%) GitHub Actions
17 84 (1.66%) Power Platform
18 55 (1.09%) Dagster
19 51 (1.01%) Cloud Computing
Communications & Networking
1 44 (0.87%) Network Security
2 38 (0.75%) TCP/IP
3 33 (0.65%) Wireless
4 29 (0.57%) HTTP
5 27 (0.53%) Modbus
6 26 (0.51%) Bluetooth
7 21 (0.42%) WAN
8 19 (0.38%) MQTT
9 16 (0.32%) 5G
9 16 (0.32%) SD-WAN
10 15 (0.30%) Wi-Fi
11 14 (0.28%) Multicast
11 14 (0.28%) RS-232
12 12 (0.24%) Ethernet
12 12 (0.24%) Firewall
13 10 (0.20%) Internet
14 9 (0.18%) ZigBee
15 8 (0.16%) RS-485
15 8 (0.16%) Software-Defined Radio
16 7 (0.14%) Profibus
Database & Business Intelligence
1 394 (7.80%) SQL Server
2 273 (5.41%) Amazon Athena
3 262 (5.19%) Dremio
4 259 (5.13%) Apache Iceberg
5 242 (4.79%) PostgreSQL
6 237 (4.69%) Apache Arrow
7 165 (3.27%) NoSQL
8 164 (3.25%) MySQL
9 163 (3.23%) Apache Ignite
10 139 (2.75%) MongoDB
11 96 (1.90%) Data Lake
12 90 (1.78%) Relational Database
13 86 (1.70%) Elasticsearch
14 58 (1.15%) Big Data
15 48 (0.95%) DynamoDB
16 47 (0.93%) Amazon RDS
17 42 (0.83%) Power BI
18 39 (0.77%) Amazon Redshift
19 29 (0.57%) Azure SQL Database
20 28 (0.55%) BigQuery
Development Applications
1 396 (7.84%) Git
2 351 (6.95%) JIRA
3 324 (6.42%) GitLab
4 254 (5.03%) SonarQube
5 250 (4.95%) Maven
6 246 (4.87%) Bitbucket
7 238 (4.71%) Cucumber
7 238 (4.71%) Selenium
8 232 (4.59%) Sonatype Nexus
9 154 (3.05%) Jenkins
10 84 (1.66%) Artifactory
11 56 (1.11%) Visual Studio
12 40 (0.79%) JUnit
13 30 (0.59%) Eclipse
14 26 (0.51%) Eclipse RCP
14 26 (0.51%) Rational DOORS
14 26 (0.51%) webpack
15 23 (0.46%) Cypress.io
16 21 (0.42%) Gradle
17 19 (0.38%) Atlassian Bamboo
General
1 1,359 (26.91%) Finance
2 761 (15.07%) Banking
3 689 (13.64%) Social Skills
4 570 (11.29%) Inclusion and Diversity
5 373 (7.39%) Front Office
6 372 (7.37%) Electronics
7 277 (5.49%) Analytical Skills
8 204 (4.04%) Retail
9 167 (3.31%) Investment Banking
10 152 (3.01%) Aerospace
11 149 (2.95%) Automotive
11 149 (2.95%) Games
12 120 (2.38%) Manufacturing
13 103 (2.04%) Law
14 88 (1.74%) Public Sector
15 74 (1.47%) Marketing
16 56 (1.11%) Advertising
17 54 (1.07%) Corporate Banking
18 48 (0.95%) Tech for Good
19 46 (0.91%) Legal
Job Titles
1 2,396 (47.45%) Software Engineer
2 1,216 (24.08%) Senior
3 874 (17.31%) Senior Software Engineer
4 602 (11.92%) Developer
5 537 (10.63%) Lead
6 513 (10.16%) Systems Engineer
7 420 (8.32%) Principal Engineer
8 318 (6.30%) AWS Engineer
9 272 (5.39%) Python Engineer
10 209 (4.14%) Java Engineer
11 203 (4.02%) AWS Software Engineer
12 198 (3.92%) Java Software Engineer
13 193 (3.82%) Software Assurance Engineer
14 175 (3.47%) Lead Software Engineer
15 170 (3.37%) Software Developer
16 156 (3.09%) Developer/Software Engineer
17 154 (3.05%) Data Engineer
18 153 (3.03%) Python Software Engineer
19 133 (2.63%) Principal Software Engineer
20 129 (2.55%) Embedded Engineer
Libraries, Frameworks & Software Standards
1 981 (19.43%) React
2 733 (14.51%) .NET
3 611 (12.10%) Node.js
4 495 (9.80%) Kafka
5 494 (9.78%) HTML
6 450 (8.91%) CSS
7 426 (8.44%) Spring
8 397 (7.86%) Spring Boot
9 324 (6.42%) Redux
10 315 (6.24%) AngularJS
11 215 (4.26%) Pandas
12 214 (4.24%) JPA
13 210 (4.16%) RESTful
14 206 (4.08%) REST
15 188 (3.72%) Hibernate
16 173 (3.43%) PySpark
17 169 (3.35%) NumPy
18 154 (3.05%) SciPy
19 146 (2.89%) .NET Core
20 144 (2.85%) Vue
Miscellaneous
1 361 (7.15%) Product Ownership
2 261 (5.17%) Enterprise Software
3 250 (4.95%) Algorithms
4 243 (4.81%) Cyberattack
5 241 (4.77%) Fixed Income
6 218 (4.32%) Self-Motivation
7 199 (3.94%) Cloud Native
8 186 (3.68%) Equities
9 177 (3.50%) Distributed Systems
10 176 (3.49%) Foreign Exchange (FX)
11 170 (3.37%) Linux Command Line
12 136 (2.69%) Management Information System
13 133 (2.63%) Hedge funds
14 125 (2.48%) Derivative
15 122 (2.42%) Mobile App
16 108 (2.14%) Embedded Systems
17 104 (2.06%) Greenfield Project
18 71 (1.41%) Public Cloud
19 65 (1.29%) Data Structures
20 61 (1.21%) IoT
Operating Systems
1 567 (11.23%) Linux
2 130 (2.57%) Windows
3 108 (2.14%) Android
4 55 (1.09%) Unix
5 53 (1.05%) Apple iOS
6 20 (0.40%) Embedded Linux
7 14 (0.28%) FreeRTOS
7 14 (0.28%) Robot Operating System
8 12 (0.24%) zOS
9 10 (0.20%) Rocky
10 9 (0.18%) Windows Server
11 5 (0.099%) Mac OS
11 5 (0.099%) Ubuntu
11 5 (0.099%) VMS
12 4 (0.079%) Red Hat Enterprise Linux
13 2 (0.040%) Debian
13 2 (0.040%) VxWorks
14 1 (0.020%) Fedora
14 1 (0.020%) Solaris
14 1 (0.020%) ThreadX
Processes & Methodologies
1 2,299 (45.52%) Agile
2 1,074 (21.27%) CI/CD
3 1,003 (19.86%) DevOps
4 924 (18.30%) Microservices
5 854 (16.91%) Systems Engineering
6 832 (16.48%) Mathematics
7 826 (16.36%) Mentoring
8 677 (13.41%) Problem-Solving
9 674 (13.35%) Full-Stack Development
10 673 (13.33%) Computer Science
11 659 (13.05%) Validation
12 619 (12.26%) SDLC
13 595 (11.78%) Test Automation
14 528 (10.46%) Containerisation
15 504 (9.98%) TDD
16 501 (9.92%) SysML
17 490 (9.70%) Verification and Validation
18 484 (9.58%) Model-Based Systems Engineering
19 461 (9.13%) Digital Twin
20 427 (8.46%) Artificial Intelligence
Programming Languages
1 1,558 (30.85%) Java
2 1,433 (28.38%) Python
3 1,355 (26.83%) JavaScript
4 849 (16.81%) SQL
5 773 (15.31%) C#
6 756 (14.97%) TypeScript
7 673 (13.33%) C++
8 598 (11.84%) MATLAB
9 462 (9.15%) Go
10 418 (8.28%) Rust
11 368 (7.29%) C
12 142 (2.81%) Ada
13 140 (2.77%) PHP
14 59 (1.17%) Ruby
15 54 (1.07%) Kotlin
16 50 (0.99%) Bash
17 48 (0.95%) Scala
18 40 (0.79%) Embedded C
19 36 (0.71%) PowerShell
20 26 (0.51%) Swift
Qualifications
1 1,562 (30.93%) Degree
2 586 (11.60%) BPSS Clearance
3 489 (9.68%) HND
4 468 (9.27%) HNC
5 448 (8.87%) Security Cleared
6 288 (5.70%) DV Cleared
7 262 (5.19%) Computer Science Degree
8 196 (3.88%) AWS Certification
9 190 (3.76%) AWS Certified Solutions Architect
10 168 (3.33%) AWS Certified Developer
11 141 (2.79%) Master's Degree
12 134 (2.65%) SC Cleared
13 96 (1.90%) Chartered Engineer
14 84 (1.66%) PhD
15 21 (0.42%) Numerate Degree
16 17 (0.34%) Azure Certification
17 14 (0.28%) DBS Check
18 9 (0.18%) ISTQB
19 5 (0.099%) TOGAF Certification
20 4 (0.079%) Microsoft Certification
Quality Assurance & Compliance
1 397 (7.86%) QA
2 128 (2.53%) Accessibility
3 56 (1.11%) ISO/IEC 12207
4 32 (0.63%) Data Quality
4 32 (0.63%) ISO/IEC 27001
5 31 (0.61%) GDPR
6 16 (0.32%) NIST
6 16 (0.32%) PMO
7 15 (0.30%) HIPAA
8 12 (0.24%) PCI DSS
9 10 (0.20%) California Consumer Privacy Act
10 8 (0.16%) NCSC
10 8 (0.16%) SLA
11 7 (0.14%) IEC 61131
11 7 (0.14%) ISO 9001
12 6 (0.12%) Cyber Essentials
12 6 (0.12%) Cyber Essentials PLUS
12 6 (0.12%) MISRA
12 6 (0.12%) Sarbanes-Oxley
12 6 (0.12%) Software Quality Assurance
System Software
1 795 (15.74%) Docker
2 69 (1.37%) Firmware
3 31 (0.61%) Embedded Firmware
4 28 (0.55%) Virtual Machines
5 10 (0.20%) Active Directory
6 9 (0.18%) VMware Infrastructure
7 1 (0.020%) NDS
7 1 (0.020%) VMware ESXi
Systems Management
1 918 (18.18%) Kubernetes
2 369 (7.31%) Terraform
3 102 (2.02%) Ansible
4 50 (0.99%) Grafana
5 48 (0.95%) Prometheus
6 14 (0.28%) Istio
7 12 (0.24%) Argo
8 9 (0.18%) CA Endevor
9 7 (0.14%) Kibana
9 7 (0.14%) Single Sign-On
10 6 (0.12%) ArcSight ESM
10 6 (0.12%) BMC PATROL
10 6 (0.12%) Kustomize
10 6 (0.12%) Progress Chef
10 6 (0.12%) QRadar
11 5 (0.099%) Puppet
12 4 (0.079%) Packer
13 2 (0.040%) Graylog
13 2 (0.040%) Microsoft Intune
13 2 (0.040%) Podman
Vendors
1 248 (4.91%) Microsoft
2 211 (4.18%) Solace
3 165 (3.27%) Google
4 87 (1.72%) Siemens
5 83 (1.64%) Oracle
6 73 (1.45%) Databricks
7 56 (1.11%) IBM
8 36 (0.71%) PayPal
9 35 (0.69%) Atlassian
10 28 (0.55%) Apple
11 27 (0.53%) Salesforce
12 22 (0.44%) Ping Identity
13 17 (0.34%) Splunk
14 15 (0.30%) New Relic
14 15 (0.30%) Red Hat
15 13 (0.26%) Adobe
15 13 (0.26%) ServiceNow
16 12 (0.24%) SAP
17 10 (0.20%) VMware
18 9 (0.18%) OpenAI