Systems Engineering Jobs

Systems Engineering
UK

The table below provides summary statistics for permanent job vacancies requiring Systems Engineering skills. It includes a benchmarking guide to the annual salaries offered in vacancies that cited Systems Engineering over the 6 months leading up to 9 May 2025, comparing them to the same period in the previous two years.

6 months to
9 May 2025
Same period 2024 Same period 2023
Rank 10 293 405
Rank change year-on-year +283 +112 +77
Permanent jobs citing Systems Engineering 6,213 979 794
As % of all permanent jobs advertised in the UK 11.47% 0.99% 0.78%
As % of the Processes & Methodologies category 12.23% 1.15% 0.82%
Number of salaries quoted 2,546 546 216
10th Percentile - £36,250 £41,250
25th Percentile £47,683 £48,000 £52,500
Median annual salary (50th Percentile) £52,600 £59,000 £66,250
Median % change year-on-year -10.85% -10.94% +5.58%
75th Percentile £60,265 £70,250 £85,000
90th Percentile £70,600 £85,000 £110,000
UK excluding London median annual salary £52,600 £55,000 £64,000
% change year-on-year -4.36% -14.06% +16.36%

All Process and Methodology Skills
UK

Systems Engineering falls under the Processes and Methodologies category. For comparison with the information above, the following table provides summary statistics for all permanent job vacancies requiring process or methodology skills.

Permanent vacancies with a requirement for process or methodology skills 50,790 84,812 96,895
As % of all permanent jobs advertised in the UK 93.76% 85.58% 95.62%
Number of salaries quoted 26,810 59,843 56,946
10th Percentile £30,000 £29,000 £34,000
25th Percentile £42,500 £40,000 £45,000
Median annual salary (50th Percentile) £57,500 £55,000 £61,180
Median % change year-on-year +4.55% -10.10% +1.97%
75th Percentile £75,000 £72,500 £81,250
90th Percentile £98,474 £92,500 £100,000
UK excluding London median annual salary £52,500 £50,000 £55,000
% change year-on-year +5.00% -9.09% +4.76%

Systems Engineering
Job Vacancy Trend

Job postings citing Systems Engineering as a proportion of all IT jobs advertised.
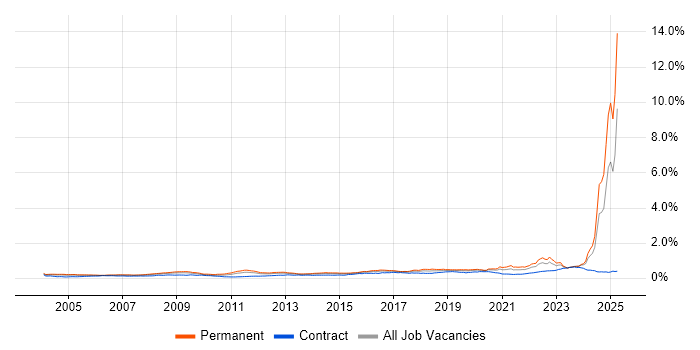
Job vacancy trend for Systems Engineering in the UK

Systems Engineering
Salary Trend

3-month moving average salary quoted in jobs citing Systems Engineering.

Salary trend for Systems Engineering in the UK

Systems Engineering
Salary Histogram

Salary distribution for jobs citing Systems Engineering over the 6 months to 9 May 2025.

Salary histogram for Systems Engineering in the UK

Systems Engineering
Top 17 Job Locations

The table below looks at the demand and provides a guide to the median salaries quoted in IT jobs citing Systems Engineering within the UK over the 6 months to 9 May 2025. The 'Rank Change' column provides an indication of the change in demand within each location based on the same 6 month period last year.

Location Rank Change
on Same Period
Last Year
Matching
Permanent
IT Job Ads
Median Salary
Past 6 Months
Median Salary
% Change
on Same Period
Last Year
Live
Jobs
UK excluding London +233 6,050 £52,600 -4.36% 669
England +252 5,316 £50,055 -12.95% 770
Midlands +196 1,678 £47,683 -13.30% 104
North of England +305 1,635 £50,055 -1.85% 120
North West +255 1,442 £50,055 -16.58% 86
South East +185 1,052 £62,000 -2.36% 190
West Midlands +167 1,003 £35,000 -36.36% 76
Work from Home +182 850 £47,683 -13.30% 561
South West +111 700 £52,600 -4.36% 153
East Midlands +148 675 £47,683 -4.63% 24
Scotland +266 625 £58,033 +25.48% 29
East of England +44 191 £47,683 -13.30% 89
Yorkshire +152 190 £47,683 -6.50% 28
Wales +94 169 £62,000 +55.00% 17
London +48 59 £77,500 +3.33% 148
North East +51 3 £60,000 -11.11% 7
Northern Ireland +35 3 - - 2

Systems Engineering
Co-occurring Skills and Capabilities by Category

The follow tables expand on the table above by listing co-occurrences grouped by category. The same employment type, locality and period is covered with up to 20 co-occurrences shown in each of the following categories:

Application Platforms
1 36 (0.58%) Confluence
2 4 (0.064%) SharePoint
3 3 (0.048%) Microsoft Exchange
3 3 (0.048%) WinCC
4 2 (0.032%) Apache Spark
Applications
1 969 (15.60%) Simulink
2 237 (3.81%) Microsoft Office
3 191 (3.07%) Microsoft Excel
4 173 (2.78%) Microsoft PowerPoint
5 123 (1.98%) Mathcad
6 41 (0.66%) Mathematica
7 14 (0.23%) Microsoft Project
7 14 (0.23%) Trello
8 2 (0.032%) AutoCAD
8 2 (0.032%) CATIA
9 1 (0.016%) GNU Octave
9 1 (0.016%) MicroStation
9 1 (0.016%) Siemens NX
Business Applications
1 352 (5.67%) Teamcenter
2 2 (0.032%) SAP GRC
2 2 (0.032%) SAP S/4HANA
3 1 (0.016%) Sparx Enterprise Architect
Cloud Services
1 55 (0.89%) AWS
2 14 (0.23%) Google Workspace
3 11 (0.18%) Microsoft 365
4 10 (0.16%) Pulumi
5 9 (0.14%) Azure
6 7 (0.11%) Amazon EC2
6 7 (0.11%) Amazon EKS
6 7 (0.11%) Amazon S3
7 6 (0.097%) Amazon ECR
7 6 (0.097%) Slack
7 6 (0.097%) Virtual Private Cloud
8 5 (0.080%) Azure DevOps
8 5 (0.080%) Azure Monitor
8 5 (0.080%) GitHub
8 5 (0.080%) GitHub Actions
9 4 (0.064%) Microsoft Copilot
10 3 (0.048%) Entra ID
10 3 (0.048%) SaaS
11 2 (0.032%) Nutanix
12 1 (0.016%) AWS Fargate
Communications & Networking
1 23 (0.37%) Wireshark
2 17 (0.27%) DHCP
2 17 (0.27%) DNS
2 17 (0.27%) TCP/IP
3 16 (0.26%) VoIP
4 15 (0.24%) Firewall
4 15 (0.24%) VLAN
4 15 (0.24%) WLAN
5 14 (0.23%) BGP
5 14 (0.23%) OSPF
6 9 (0.14%) WAN
7 5 (0.080%) Wireless
8 4 (0.064%) 4G
8 4 (0.064%) 5G
8 4 (0.064%) Network Security
8 4 (0.064%) Unified Communications
9 3 (0.048%) LAN
10 2 (0.032%) ATM
10 2 (0.032%) Ethernet
10 2 (0.032%) MQTT
Database & Business Intelligence
1 34 (0.55%) MySQL
2 28 (0.45%) Relational Database
3 18 (0.29%) MongoDB
4 4 (0.064%) Data Warehouse
4 4 (0.064%) Metadata
5 2 (0.032%) Big Data
5 2 (0.032%) Hadoop
5 2 (0.032%) MS Access
5 2 (0.032%) NoSQL
5 2 (0.032%) SAP BW
6 1 (0.016%) Geospatial Data
6 1 (0.016%) GIS
Development Applications
1 974 (15.68%) Rational DOORS
2 125 (2.01%) JIRA
3 37 (0.60%) Git
4 28 (0.45%) Bitbucket
5 12 (0.19%) GitLab
6 2 (0.032%) Rational Rhapsody
7 1 (0.016%) LabVIEW
General
1 940 (15.13%) Aerospace
2 821 (13.21%) Automotive
3 816 (13.13%) Electronics
4 783 (12.60%) Social Skills
5 519 (8.35%) Presentation Skills
6 315 (5.07%) Telecoms
7 219 (3.52%) Avionics
8 201 (3.24%) Law
9 154 (2.48%) Aeronautics
10 114 (1.83%) Influencing Skills
11 66 (1.06%) Military
12 44 (0.71%) Finance
13 41 (0.66%) Aviation
14 40 (0.64%) Analytical Skills
15 28 (0.45%) Legal
16 26 (0.42%) Documentation Skills
17 25 (0.40%) Public Sector
18 20 (0.32%) Retail
19 17 (0.27%) Inclusion and Diversity
19 17 (0.27%) Manufacturing
Job Titles
1 3,179 (51.17%) Systems Engineer
2 2,084 (33.54%) Principal Engineer
3 1,847 (29.73%) Principal Systems Engineer
4 1,787 (28.76%) Senior
5 1,174 (18.90%) Senior Systems Engineer
6 411 (6.62%) Engineering Manager
7 352 (5.67%) Integration Engineer
8 351 (5.65%) Systems Integration Engineer
9 341 (5.49%) Lead
10 283 (4.55%) Validation Engineer
11 276 (4.44%) System Verification Engineer
12 274 (4.41%) Lead Systems Engineer
13 193 (3.11%) Software Assurance Engineer
14 192 (3.09%) Requirements Engineer
15 191 (3.07%) Requirements Manager
16 155 (2.49%) Junior
17 145 (2.33%) Junior Systems Engineer
18 136 (2.19%) Software Engineer
19 132 (2.12%) Team Leader
20 99 (1.59%) Software Development Engineer
Libraries, Frameworks & Software Standards
1 28 (0.45%) .NET
2 12 (0.19%) Kafka
3 6 (0.097%) Django
3 6 (0.097%) Flask
3 6 (0.097%) Lambda Expressions
3 6 (0.097%) React
4 3 (0.048%) RESTful
5 2 (0.032%) gRPC
5 2 (0.032%) Middleware
5 2 (0.032%) SAP Fiori
6 1 (0.016%) boto
6 1 (0.016%) Flash
6 1 (0.016%) REST
Miscellaneous
1 366 (5.89%) Algorithms
2 160 (2.58%) Management Information System
3 19 (0.31%) SCADA
4 14 (0.23%) Data Centre
4 14 (0.23%) Smartphone
4 14 (0.23%) Social Media
5 12 (0.19%) Public Cloud
5 12 (0.19%) Renewable Energy
6 8 (0.13%) Product Ownership
7 6 (0.097%) Embedded Systems
7 6 (0.097%) IoT
7 6 (0.097%) Molecular Biology
7 6 (0.097%) Operational Technology
8 5 (0.080%) Analytical Mindset
8 5 (0.080%) Cloud Native
9 4 (0.064%) FMCG
9 4 (0.064%) Microsoft Licensing
9 4 (0.064%) NHS
9 4 (0.064%) PKI
10 3 (0.048%) Acoustics
Operating Systems
1 87 (1.40%) Linux
2 76 (1.22%) Windows
3 21 (0.34%) Windows Server
4 15 (0.24%) Windows Server 2019
5 14 (0.23%) Mac OS X
5 14 (0.23%) Ubuntu
5 14 (0.23%) Windows 10
5 14 (0.23%) Windows Server 2016
6 3 (0.048%) Red Hat Enterprise Linux
7 2 (0.032%) Windows Server 2012
8 1 (0.016%) VxWorks
Processes & Methodologies
1 1,993 (32.08%) Model-Based Systems Engineering
2 1,745 (28.09%) Validation
3 1,560 (25.11%) SysML
4 1,558 (25.08%) Mathematics
5 1,344 (21.63%) Verification and Validation
6 966 (15.55%) Agile
7 960 (15.45%) Physics
8 854 (13.75%) Software Engineering
9 818 (13.17%) Requirements Management
10 706 (11.36%) UML
11 636 (10.24%) Coaching
12 561 (9.03%) Cybersecurity
13 516 (8.31%) Collaborative Working
14 514 (8.27%) MODAF
15 461 (7.42%) Digital Twin
16 416 (6.70%) Problem-Solving
17 408 (6.57%) Project Planning
18 399 (6.42%) Technical Leadership
19 370 (5.96%) FMEA
20 366 (5.89%) Stakeholder Management
Programming Languages
1 1,663 (26.77%) MATLAB
2 119 (1.92%) R
3 115 (1.85%) Python
4 39 (0.63%) C
4 39 (0.63%) C#
5 26 (0.42%) Java
6 23 (0.37%) C++
7 22 (0.35%) SQL
8 20 (0.32%) PowerShell
9 14 (0.23%) Ruby
10 13 (0.21%) Go
11 10 (0.16%) Bicep
12 6 (0.097%) JavaScript
12 6 (0.097%) TypeScript
13 5 (0.080%) Embedded C
13 5 (0.080%) Kusto Query Language
14 4 (0.064%) VB
15 3 (0.048%) Ada
16 2 (0.032%) Embedded C++
16 2 (0.032%) Perl
Qualifications
1 4,755 (76.53%) BPSS Clearance
2 4,226 (68.02%) Degree
3 943 (15.18%) HND
4 903 (14.53%) HNC
5 527 (8.48%) Chartered Engineer
6 195 (3.14%) Master's Degree
7 150 (2.41%) ISTQB
8 49 (0.79%) Security Cleared
9 43 (0.69%) SC Cleared
10 24 (0.39%) Numerate Degree
11 22 (0.35%) CEH
12 19 (0.31%) Microsoft Certification
13 17 (0.27%) Computer Science Degree
14 15 (0.24%) DBS Check
15 14 (0.23%) MCSE
15 14 (0.23%) PMI Certification
15 14 (0.23%) PMP
16 11 (0.18%) PhD
17 4 (0.064%) CISSP
17 4 (0.064%) TOGAF Certification
Quality Assurance & Compliance
1 668 (10.75%) ISO/IEC 15288
2 551 (8.87%) IEC 61508
3 379 (6.10%) Def Stans
4 185 (2.98%) DO-254
5 163 (2.62%) ARP4754
6 18 (0.29%) QA
7 6 (0.097%) Automotive SPICE
8 5 (0.080%) ISO 26262
9 4 (0.064%) ISO/IEC 27001
9 4 (0.064%) PCI DSS
9 4 (0.064%) Sarbanes-Oxley
10 3 (0.048%) Accessibility
10 3 (0.048%) GRC
11 2 (0.032%) IEC 61131
11 2 (0.032%) ITGC
11 2 (0.032%) NIST
12 1 (0.016%) ARP4761
12 1 (0.016%) ECSS
12 1 (0.016%) NIST 800
12 1 (0.016%) RMADS
System Software
1 23 (0.37%) Virtual Machines
2 22 (0.35%) Firmware
3 21 (0.34%) Active Directory
4 17 (0.27%) Docker
5 4 (0.064%) VMware ESXi
5 4 (0.064%) vSphere
6 1 (0.016%) VMware Infrastructure
Systems Management
1 44 (0.71%) Ansible
2 31 (0.50%) Functional Safety
3 22 (0.35%) Kubernetes
4 18 (0.29%) Terraform
5 15 (0.24%) Progress Chef
6 10 (0.16%) Podman
6 10 (0.16%) Puppet
7 6 (0.097%) Kustomize
8 5 (0.080%) Grafana
8 5 (0.080%) Prometheus
9 2 (0.032%) Active Directory Federation Services
9 2 (0.032%) Single Sign-On
10 1 (0.016%) HP ALM
10 1 (0.016%) Microsoft Intune
10 1 (0.016%) SmoothWall
Vendors
1 581 (9.35%) IBM
2 251 (4.04%) Microsoft
3 207 (3.33%) ANSYS
4 133 (2.14%) MathWorks
5 42 (0.68%) Siemens
6 29 (0.47%) Atlassian
7 20 (0.32%) VMware
8 19 (0.31%) Dell
9 17 (0.27%) Cisco
10 15 (0.24%) Fortinet
10 15 (0.24%) Google
11 14 (0.23%) Apple
11 14 (0.23%) Ubiquiti
12 9 (0.14%) Avaloq
12 9 (0.14%) Facebook
12 9 (0.14%) YouTube
13 6 (0.097%) Sawtooth Software
14 5 (0.080%) EMC
15 4 (0.064%) Extreme Networks
15 4 (0.064%) Oracle