Senior Jobs in the West Midlands

Senior
England > West Midlands

The median Senior salary in the West Midlands is £65,000 per year, according to job vacancies posted during the 6 months leading to 2 April 2025.

The table below provides salary benchmarking and summary statistics, comparing them to the same period in the previous two years.

6 months to
2 Apr 2025
Same period 2024 Same period 2023
Rank 14 9 20
Rank change year-on-year -5 +11 -6
Permanent jobs requiring a Senior 403 821 817
As % of all permanent jobs advertised in the West Midlands 9.65% 12.22% 11.31%
As % of the Job Titles category 10.86% 13.05% 12.51%
Number of salaries quoted 201 641 427
10th Percentile £43,500 £40,000 £41,150
25th Percentile £51,672 £47,500 £48,750
Median annual salary (50th Percentile) £65,000 £57,965 £57,500
Median % change year-on-year +12.14% +0.81% -
75th Percentile £75,000 £67,500 £71,250
90th Percentile £101,250 £75,772 £85,000
England median annual salary £62,500 £64,080 £70,000
% change year-on-year -2.47% -8.46% -

All Permanent IT Job Vacancies
West Midlands

For comparison with the information above, the following table provides summary statistics for all permanent IT job vacancies in the West Midlands. Most job vacancies include a discernible job title that can be normalized. As such, the figures in the second row provide an indication of the number of permanent jobs in our overall sample.

Permanent vacancies in the West Midlands with a recognized job title 3,710 6,290 6,533
% of permanent jobs with a recognized job title 88.80% 93.62% 90.41%
Number of salaries quoted 1,802 4,913 3,546
10th Percentile £29,550 £26,250 £29,750
25th Percentile £38,750 £35,000 £38,966
Median annual salary (50th Percentile) £52,500 £50,000 £52,500
Median % change year-on-year +5.00% -4.76% +5.00%
75th Percentile £67,500 £63,117 £67,500
90th Percentile £80,000 £77,500 £77,500
England median annual salary £57,560 £55,000 £60,249
% change year-on-year +4.65% -8.71% +0.42%

Senior
Job Vacancy Trend in the West Midlands

Job postings that featured Senior in the job title as a proportion of all IT jobs advertised in the West Midlands.
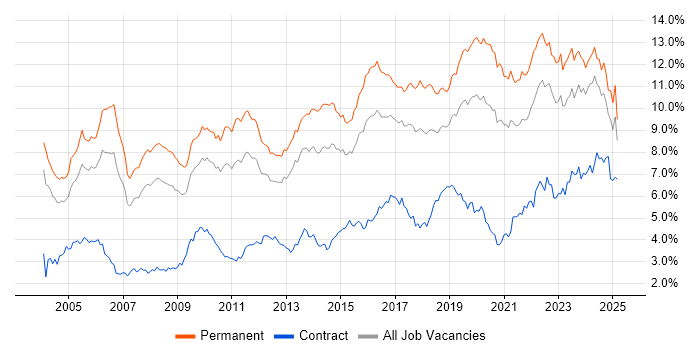
Job vacancy trend for Senior in the West Midlands

Senior
Salary Trend in the West Midlands

3-month moving average salary quoted in jobs citing Senior in the West Midlands.

Salary trend for Senior in the West Midlands

Senior
Salary Histogram in the West Midlands

Salary distribution for jobs citing Senior in the West Midlands over the 6 months to 2 April 2025.

Salary histogram for Senior in the West Midlands

Senior
Job Locations in the West Midlands

The table below looks at the demand and provides a guide to the median salaries quoted in IT jobs citing Senior within the West Midlands region over the 6 months to 2 April 2025. The 'Rank Change' column provides an indication of the change in demand within each location based on the same 6 month period last year.

Location Rank Change
on Same Period
Last Year
Matching
Permanent
IT Job Ads
Median Salary
Past 6 Months
Median Salary
% Change
on Same Period
Last Year
Live
Jobs
Birmingham -3 197 £67,626 +12.71% 137
Warwickshire -10 107 £70,000 +33.33% 38
Coventry -6 28 £60,000 -7.69% 28
Staffordshire -7 19 £51,672 +3.34% 65
Solihull -8 17 £50,000 -20.00% 3
Worcestershire -5 13 £65,000 +23.81% 17
Shropshire +6 9 £70,000 +27.27% 13
Herefordshire +6 4 - -
Wolverhampton +11 3 £95,000 +46.15% 9
Walsall - 1 £60,000 - 4
Senior
England

Senior Skill Set
Top 30 Co-occurring Skills and Capabilities in the West Midlands

For the 6 months to 2 April 2025, Senior job roles required the following skills and capabilities in order of popularity. The figures indicate the absolute number co-occurrences and as a proportion of all permanent job ads across the West Midlands region featuring Senior in the job title.

1 127 (31.51%) Azure
2 102 (25.31%) Agile
3 95 (23.57%) Degree
4 84 (20.84%) Finance
5 81 (20.10%) Social Skills
6 73 (18.11%) C#
7 71 (17.62%) .NET
8 70 (17.37%) Cybersecurity
9 68 (16.87%) BPSS Clearance
10 65 (16.13%) Microsoft
11 64 (15.88%) SQL
12 62 (15.38%) DevOps
13 61 (15.14%) CI/CD
14 60 (14.89%) Problem-Solving
15 56 (13.90%) Mentoring
16 52 (12.90%) Risk Management
17 47 (11.66%) Coaching
18 46 (11.41%) Computer Science
19 44 (10.92%) Inclusion and Diversity
20 43 (10.67%) Azure DevOps
21 42 (10.42%) Software Engineering
22 41 (10.17%) Analytics
23 40 (9.93%) Project Management
24 35 (8.68%) HTML
24 35 (8.68%) Telecoms
25 31 (7.69%) Retail
25 31 (7.69%) Linux
26 30 (7.44%) Git
26 30 (7.44%) Full-Stack Development
26 30 (7.44%) Creative Thinking

Senior Skill Set
Co-occurring Skills and Capabilities in the West Midlands by Category

The follow tables expand on the table above by listing co-occurrences grouped by category. The same employment type, locality and period is covered with up to 20 co-occurrences shown in each of the following categories:

Application Platforms
1 17 (4.22%) Confluence
2 10 (2.48%) SharePoint
3 3 (0.74%) CMS
4 2 (0.50%) Headless CMS
4 2 (0.50%) Jupyter
4 2 (0.50%) Oracle SOA Suite
5 1 (0.25%) Apache
5 1 (0.25%) Apache Spark
5 1 (0.25%) ArcGIS
5 1 (0.25%) Microsoft Exchange
5 1 (0.25%) Mule
5 1 (0.25%) SAS
5 1 (0.25%) Sitefinity
Applications
1 6 (1.49%) Microsoft Project
2 5 (1.24%) Microsoft Excel
3 3 (0.74%) ProjectWise
3 3 (0.74%) Simulink
4 1 (0.25%) Microsoft Office
4 1 (0.25%) Microsoft PowerPoint
4 1 (0.25%) Revit
4 1 (0.25%) Trello
Business Applications
1 18 (4.47%) Dynamics AX
2 10 (2.48%) NEC Housing
3 7 (1.74%) Dynamics CRM
4 4 (0.99%) Oracle EBS
4 4 (0.99%) SAP S/4HANA
5 3 (0.74%) NetSuite
6 2 (0.50%) Oracle ERP
6 2 (0.50%) Oracle SCM
6 2 (0.50%) PeopleSoft HCM
7 1 (0.25%) SAP CO
7 1 (0.25%) SAP FI
7 1 (0.25%) SAP FI/CO
7 1 (0.25%) Shopify
Cloud Services
1 127 (31.51%) Azure
2 43 (10.67%) Azure DevOps
3 24 (5.96%) Microsoft 365
4 18 (4.47%) Power Platform
5 14 (3.47%) AWS
5 14 (3.47%) GitHub
6 11 (2.73%) GitHub Actions
7 8 (1.99%) Dynamics 365
8 7 (1.74%) SaaS
8 7 (1.74%) Serverless
9 6 (1.49%) GCP
10 5 (1.24%) Azure Sentinel
10 5 (1.24%) Azure Service Bus
11 4 (0.99%) Azure Data Factory
12 3 (0.74%) Amazon ECS
12 3 (0.74%) AWS Lambda
12 3 (0.74%) Azure Functions
12 3 (0.74%) Cloud Computing
12 3 (0.74%) PowerApps
12 3 (0.74%) Vercel
Communications & Networking
1 20 (4.96%) Wi-Fi
2 15 (3.72%) Firewall
2 15 (3.72%) SD-WAN
2 15 (3.72%) WAN
3 12 (2.98%) VLAN
4 11 (2.73%) 3GPP
4 11 (2.73%) 5G
5 9 (2.23%) Network Security
5 9 (2.23%) Wireless
6 5 (1.24%) Bluetooth
6 5 (1.24%) GSM
6 5 (1.24%) J1939
7 3 (0.74%) VPN
8 2 (0.50%) Cisco Nexus
8 2 (0.50%) HTTP
8 2 (0.50%) HTTPS
8 2 (0.50%) Internet
8 2 (0.50%) IPsec
8 2 (0.50%) MQTT
8 2 (0.50%) TCP/IP
Database & Business Intelligence
1 23 (5.71%) SQL Server
2 16 (3.97%) PostgreSQL
3 13 (3.23%) Relational Database
4 12 (2.98%) BusinessObjects
4 12 (2.98%) Power BI
5 11 (2.73%) MySQL
5 11 (2.73%) Redis
6 7 (1.74%) Data Warehouse
7 4 (0.99%) Big Data
7 4 (0.99%) NoSQL
8 3 (0.74%) Data Lake
8 3 (0.74%) GIS
9 2 (0.50%) Amazon RDS
9 2 (0.50%) Azure SQL Database
9 2 (0.50%) Elasticsearch
9 2 (0.50%) Metadata
9 2 (0.50%) Metadata Repository
9 2 (0.50%) MS Access
9 2 (0.50%) Oracle Database
9 2 (0.50%) Tableau
Development Applications
1 30 (7.44%) Git
2 29 (7.20%) JIRA
3 11 (2.73%) Bitbucket
4 9 (2.23%) SonarQube
5 4 (0.99%) JUnit
5 4 (0.99%) Rational DOORS
6 2 (0.50%) GitLab
6 2 (0.50%) Jenkins
6 2 (0.50%) Mockito
6 2 (0.50%) NUnit
7 1 (0.25%) Robot Framework
7 1 (0.25%) SpecFlow
7 1 (0.25%) Visual Studio Team System
7 1 (0.25%) Vite
General
1 84 (20.84%) Finance
2 81 (20.10%) Social Skills
3 44 (10.92%) Inclusion and Diversity
4 35 (8.68%) Telecoms
5 31 (7.69%) Retail
6 24 (5.96%) Manufacturing
6 24 (5.96%) Public Sector
7 18 (4.47%) Games
8 17 (4.22%) Analytical Skills
8 17 (4.22%) Police
9 12 (2.98%) Automotive
10 10 (2.48%) Local Government
10 10 (2.48%) Tech for Good
11 7 (1.74%) Banking
11 7 (1.74%) Marketing
12 6 (1.49%) Documentation Skills
12 6 (1.49%) Law
12 6 (1.49%) Legal
13 3 (0.74%) Advertising
13 3 (0.74%) Social Housing
Libraries, Frameworks & Software Standards
1 71 (17.62%) .NET
2 35 (8.68%) HTML
3 22 (5.46%) MvvmCross
4 21 (5.21%) ASP.NET
4 21 (5.21%) CSS
5 19 (4.71%) React
6 17 (4.22%) RESTful
7 14 (3.47%) Blazor
8 13 (3.23%) ASP.NET MVC
8 13 (3.23%) REST
9 12 (2.98%) FastAPI
10 11 (2.73%) Django
11 10 (2.48%) AngularJS
11 10 (2.48%) GraphQL
11 10 (2.48%) Node.js
11 10 (2.48%) OAuth
12 9 (2.23%) Flask
12 9 (2.23%) pytest
12 9 (2.23%) SQLAlchemy
12 9 (2.23%) WebSockets
Miscellaneous
1 24 (5.96%) Mobile App
2 20 (4.96%) Blockchain
2 20 (4.96%) Robotics
3 18 (4.47%) Management Information System
4 11 (2.73%) Onboarding
5 8 (1.99%) Data Protection Act
5 8 (1.99%) IoT
6 7 (1.74%) Enterprise Software
7 6 (1.49%) Driving Licence
7 6 (1.49%) Renewable Energy
8 4 (0.99%) Distributed Systems
8 4 (0.99%) Hackathon
9 3 (0.74%) Algorithms
9 3 (0.74%) Cloud Native
9 3 (0.74%) Data Centre
9 3 (0.74%) Greenfield Project
9 3 (0.74%) Lidar
9 3 (0.74%) Product Ownership
9 3 (0.74%) Public Cloud
9 3 (0.74%) Virtual Team
Operating Systems
1 31 (7.69%) Linux
2 25 (6.20%) Apple iOS
3 24 (5.96%) Windows
4 23 (5.71%) Android
5 10 (2.48%) Solaris
6 7 (1.74%) Windows Server
7 5 (1.24%) Embedded Linux
8 3 (0.74%) Unix
9 2 (0.50%) Oracle Linux
9 2 (0.50%) Windows 10
9 2 (0.50%) Windows Server 2012
10 1 (0.25%) Windows 7
Processes & Methodologies
1 102 (25.31%) Agile
2 70 (17.37%) Cybersecurity
3 62 (15.38%) DevOps
4 61 (15.14%) CI/CD
5 60 (14.89%) Problem-Solving
6 56 (13.90%) Mentoring
7 52 (12.90%) Risk Management
8 47 (11.66%) Coaching
9 46 (11.41%) Computer Science
10 42 (10.42%) Software Engineering
11 41 (10.17%) Analytics
12 40 (9.93%) Project Management
13 30 (7.44%) Creative Thinking
13 30 (7.44%) Full-Stack Development
14 29 (7.20%) Project Delivery
15 25 (6.20%) Artificial Intelligence
15 25 (6.20%) Systems Engineering
15 25 (6.20%) Unit Testing
16 24 (5.96%) Stakeholder Engagement
17 23 (5.71%) Data Analytics
Programming Languages
1 73 (18.11%) C#
2 64 (15.88%) SQL
3 29 (7.20%) JavaScript
4 26 (6.45%) Python
5 13 (3.23%) C
6 10 (2.48%) TypeScript
7 6 (1.49%) Java
8 5 (1.24%) C++
9 4 (0.99%) PHP
9 4 (0.99%) PowerShell
10 3 (0.74%) Bash
10 3 (0.74%) MATLAB
10 3 (0.74%) Ruby
10 3 (0.74%) Swift
11 2 (0.50%) Embedded C
11 2 (0.50%) PL/SQL
11 2 (0.50%) Scala
11 2 (0.50%) T-SQL
12 1 (0.25%) ABAP
12 1 (0.25%) VBA
Qualifications
1 95 (23.57%) Degree
2 68 (16.87%) BPSS Clearance
3 25 (6.20%) Security Cleared
4 18 (4.47%) CISA
4 18 (4.47%) ISACA
5 14 (3.47%) SC Cleared
6 11 (2.73%) DBS Check
7 8 (1.99%) ACCA
8 5 (1.24%) HND
8 5 (1.24%) PMI Certification
9 4 (0.99%) CCNP
9 4 (0.99%) Cisco Certification
9 4 (0.99%) DV Cleared
9 4 (0.99%) PMP
10 3 (0.74%) Computer Science Degree
11 2 (0.50%) CCIE
11 2 (0.50%) CCNA
11 2 (0.50%) CITP
11 2 (0.50%) ITIL Certification
11 2 (0.50%) Microsoft Certification
Quality Assurance & Compliance
1 20 (4.96%) ITGC
2 11 (2.73%) NCSC
3 10 (2.48%) Accessibility
3 10 (2.48%) IFRS
3 10 (2.48%) ISO 9001
4 8 (1.99%) GAAP
5 7 (1.74%) QA
6 5 (1.24%) Automotive SPICE
6 5 (1.24%) AUTOSAR
7 4 (0.99%) Data Quality
7 4 (0.99%) PMO
8 2 (0.50%) California Consumer Privacy Act
8 2 (0.50%) COBIT
8 2 (0.50%) GDPR
8 2 (0.50%) IFRS 17
8 2 (0.50%) IFRS 9
8 2 (0.50%) ISO/IEC 27001
9 1 (0.25%) Cyber Essentials
9 1 (0.25%) NIST
9 1 (0.25%) SLA
System Software
1 18 (4.47%) Docker
2 12 (2.98%) Active Directory
3 8 (1.99%) Virtual Desktop
4 6 (1.49%) Firmware
5 5 (1.24%) Hyper-V
5 5 (1.24%) VMware Infrastructure
6 1 (0.25%) Embedded Firmware
Systems Management
1 17 (4.22%) Kubernetes
2 10 (2.48%) Ansible
3 9 (2.23%) Grafana
3 9 (2.23%) Prometheus
4 8 (1.99%) Microsoft Intune
5 6 (1.49%) Terraform
6 2 (0.50%) AWS Copilot
6 2 (0.50%) Single Sign-On
7 1 (0.25%) Functional Safety
7 1 (0.25%) Progress Chef
7 1 (0.25%) Puppet
Vendors
1 65 (16.13%) Microsoft
2 29 (7.20%) Oracle
3 23 (5.71%) SAP
4 22 (5.46%) Xamarin
5 11 (2.73%) NEC
6 10 (2.48%) Cisco
6 10 (2.48%) Citrix
7 9 (2.23%) Atlassian
8 8 (1.99%) Adobe
8 8 (1.99%) Apple
9 7 (1.74%) Acronis
9 7 (1.74%) Databricks
10 6 (1.49%) VMware
11 5 (1.24%) Google
11 5 (1.24%) SolarWinds
11 5 (1.24%) WatchGuard
12 4 (0.99%) Okta
13 2 (0.50%) Hyperion
13 2 (0.50%) JD Edwards
13 2 (0.50%) Telerik