Hybrid/Remote Data Modelling Job Trends

Data Modelling
UK > Work from Home

The table below provides summary statistics and salary benchmarking for remote or hybrid work requiring Data Modelling skills. It covers permanent job vacancies from the 6 months leading up to 12 November 2025, with comparisons to the same periods in the previous two years.

6 months to
12 Nov 2025
Same period 2024 Same period 2023
Rank 111 114 95
Rank change year-on-year +3 -19 +42
Permanent jobs citing Data Modelling 412 524 716
As % of all permanent jobs with remote/hybrid work options 2.62% 2.66% 3.28%
As % of the Processes & Methodologies category 2.84% 3.01% 3.46%
Number of salaries quoted 268 252 506
10th Percentile £47,125 £42,625 £42,284
25th Percentile £55,313 £56,250 £50,000
Median annual salary (50th Percentile) £65,000 £70,000 £67,500
Median % change year-on-year -7.14% +3.70% -
75th Percentile £84,063 £82,500 £85,000
90th Percentile £109,125 £96,700 £97,500
UK median annual salary £70,000 £67,500 £67,500
% change year-on-year +3.70% - +3.85%

All Process and Methodology Skills
Work from Home

Data Modelling falls under the Processes and Methodologies category. For comparison with the information above, the following table provides summary statistics for all permanent job vacancies with remote or hybrid options requiring process or methodology skills.

Permanent vacancies with a requirement for process or methodology skills 14,522 17,412 20,717
As % of all permanent jobs with a WFH option 92.19% 88.49% 95.01%
Number of salaries quoted 8,735 10,325 16,735
10th Percentile £29,250 £36,250 £37,000
25th Percentile £39,965 £46,250 £47,000
Median annual salary (50th Percentile) £57,500 £62,500 £62,500
Median % change year-on-year -8.00% - -
75th Percentile £77,500 £81,250 £81,194
90th Percentile £98,000 £100,000 £97,500
UK median annual salary £54,500 £60,000 £60,000
% change year-on-year -9.17% - -

Data Modelling
Job Vacancy Trend for Remote/Hybrid Jobs

Historical trend showing the proportion of permanent IT job postings citing Data Modelling and offering remote or hybrid work options relative to all permanent IT jobs advertised.
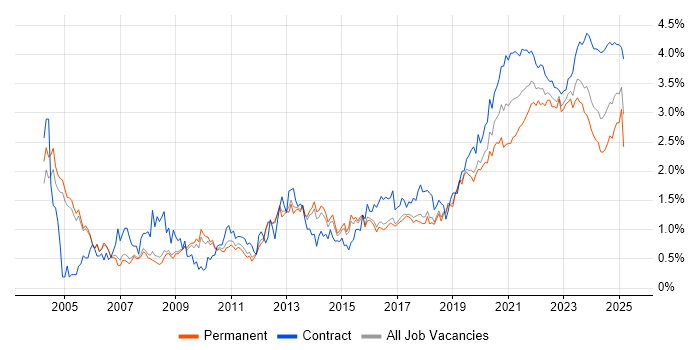
Data Modelling job vacancy trend for remote/hybrid jobs

Data Modelling
Salary Trend for Remote/Hybrid Jobs

Salary distribution trend for jobs with remote/hybrid work options citing Data Modelling.

Salary distribution trend for jobs with remote/hybrid work options citing Data Modelling

Data Modelling
Salary Histogram for Remote/Hybrid Jobs

Salary distribution for jobs with remote/hybrid work options citing Data Modelling over the 6 months to 12 November 2025.

Data Modelling salary histogram for jobs with remote/hybrid work options

Data Modelling
Co-Occurring Skills & Capabilities in Remote/Hybrid Jobs by Category

The following tables expand on the one above by listing co-occurrences grouped by category. They cover the same employment type, locality and period, with up to 20 co-occurrences shown in each category:

Application Platforms
1 16 (3.88%) Apache
1 16 (3.88%) Confluence
2 12 (2.91%) Apache Airflow
3 10 (2.43%) Apache Spark
4 6 (1.46%) SharePoint
5 3 (0.73%) SAS
6 2 (0.49%) Mendix
7 1 (0.24%) Luigi
Applications
1 33 (8.01%) Microsoft Excel
2 4 (0.97%) Chatbot
2 4 (0.97%) Microsoft Office
2 4 (0.97%) MS Visio
3 3 (0.73%) Microsoft PowerPoint
4 2 (0.49%) Trello
5 1 (0.24%) Microsoft Project
5 1 (0.24%) PlantUML
5 1 (0.24%) Sketch
5 1 (0.24%) Spreadsheet
Business Applications
1 8 (1.94%) Dynamics CRM
2 3 (0.73%) Shopify
2 3 (0.73%) Sparx Enterprise Architect
3 2 (0.49%) Markit EDM
4 1 (0.24%) Aladdin
4 1 (0.24%) Dynamics GP
4 1 (0.24%) Elite 3E
4 1 (0.24%) NetSuite
4 1 (0.24%) Salesforce CRM
4 1 (0.24%) SAP HCM
4 1 (0.24%) SAP HR
4 1 (0.24%) SAP S/4HANA
Cloud Services
1 225 (54.61%) Azure
2 108 (26.21%) Power Platform
3 86 (20.87%) Snowflake
4 84 (20.39%) AWS
5 48 (11.65%) Azure DevOps
6 46 (11.17%) Azure Data Factory
7 45 (10.92%) SaaS
8 43 (10.44%) GitHub
9 40 (9.71%) Azure Synapse Analytics
9 40 (9.71%) GCP
10 36 (8.74%) Serverless
11 30 (7.28%) dbt
12 24 (5.83%) GitHub Copilot
13 21 (5.10%) Amazon S3
14 20 (4.85%) AWS Lambda
15 16 (3.88%) Power Automate
15 16 (3.88%) PowerApps
16 13 (3.16%) AWS CloudFormation
16 13 (3.16%) Dynamics 365
17 11 (2.67%) Salesforce Sales Cloud
Communications & Networking
1 4 (0.97%) Broadband
2 1 (0.24%) ADSL
2 1 (0.24%) Internet
2 1 (0.24%) SAN
Database & Business Intelligence
1 159 (38.59%) Data Warehouse
2 100 (24.27%) Power BI
3 66 (16.02%) Data Lake
4 39 (9.47%) Metadata
5 34 (8.25%) SQL Server
6 32 (7.77%) Azure SQL Database
7 25 (6.07%) SQL Server Reporting Services
8 23 (5.58%) Snowflake Schema
9 19 (4.61%) Amazon Redshift
10 18 (4.37%) Data Vault
10 18 (4.37%) Tableau
11 17 (4.13%) Power Query
12 14 (3.40%) MySQL
12 14 (3.40%) Relational Database
12 14 (3.40%) SQL Server Integration Services
13 12 (2.91%) NoSQL
14 11 (2.67%) Azure SQL Data Warehouse
14 11 (2.67%) BigQuery
14 11 (2.67%) Data Mining
15 8 (1.94%) DynamoDB
Development Applications
1 38 (9.22%) JIRA
2 20 (4.85%) Git
3 17 (4.13%) ER Studio
4 16 (3.88%) ERwin
5 4 (0.97%) git-flow
5 4 (0.97%) Jenkins
5 4 (0.97%) PowerDesigner
6 1 (0.24%) LSMW
6 1 (0.24%) SonarQube
6 1 (0.24%) Subversion
General
1 152 (36.89%) Social Skills
2 141 (34.22%) Finance
3 95 (23.06%) Analytical Skills
4 41 (9.95%) Inclusion and Diversity
5 28 (6.80%) Public Sector
6 22 (5.34%) Law
7 21 (5.10%) Retail
8 19 (4.61%) Marketing
9 18 (4.37%) Banking
10 17 (4.13%) Presentation Skills
11 10 (2.43%) Manufacturing
12 8 (1.94%) Legal
13 6 (1.46%) Advertising
13 6 (1.46%) Investment Banking
13 6 (1.46%) Pharmaceutical
14 5 (1.21%) Retail Banking
14 5 (1.21%) Tech for Good
15 4 (0.97%) Billing
16 3 (0.73%) Back Office
16 3 (0.73%) Local Government
Job Titles
1 110 (26.70%) Architect
2 85 (20.63%) Senior
3 84 (20.39%) Data Architect
4 79 (19.17%) Data Engineer
5 50 (12.14%) Analyst
5 50 (12.14%) Developer
6 34 (8.25%) Lead
6 34 (8.25%) Senior Data Engineer
7 21 (5.10%) Business Analyst
8 16 (3.88%) Azure Architect
8 16 (3.88%) Solutions Architect
9 15 (3.64%) Azure Data Architect
9 15 (3.64%) Data Manager
10 14 (3.40%) Business Intelligence Analyst
11 13 (3.16%) Consultant
11 13 (3.16%) Data Modeller
11 13 (3.16%) Python Engineer
12 12 (2.91%) Business Intelligence Lead
12 12 (2.91%) Business Manager
12 12 (2.91%) Insight Manager
Libraries, Frameworks & Software Standards
1 25 (6.07%) REST
2 20 (4.85%) .NET
3 19 (4.61%) Lightning Web Components
4 18 (4.37%) JSON
5 16 (3.88%) SOAP
6 15 (3.64%) Kafka
7 14 (3.40%) CSS
7 14 (3.40%) HTML
8 13 (3.16%) XML
9 10 (2.43%) Middleware
10 9 (2.18%) Visualforce
11 6 (1.46%) AWS CDK
11 6 (1.46%) PySpark
11 6 (1.46%) RESTful
12 5 (1.21%) RabbitMQ
12 5 (1.21%) React
13 4 (0.97%) ADO
13 4 (0.97%) Material-UI
14 3 (0.73%) HTML5 Canvas
14 3 (0.73%) Node.js
Miscellaneous
1 31 (7.52%) Cloud Native
2 29 (7.04%) Product Ownership
3 18 (4.37%) Management Information System
4 17 (4.13%) Legacy Systems
5 16 (3.88%) Data Structures
5 16 (3.88%) Enterprise Software
6 14 (3.40%) Analytical Mindset
7 6 (1.46%) Reinsurance
7 6 (1.46%) Virtual Team
8 5 (1.21%) Data Protection Act
8 5 (1.21%) Distributed Systems
8 5 (1.21%) Reference Data
9 4 (0.97%) Foreign Exchange (FX)
9 4 (0.97%) Hybrid Cloud
9 4 (0.97%) Legacy Code
9 4 (0.97%) Market Risk
10 3 (0.73%) CMDB
10 3 (0.73%) IoT
10 3 (0.73%) Operational Technology
11 2 (0.49%) Low-Code
Operating Systems
1 4 (0.97%) Android
2 3 (0.73%) Apple iOS
2 3 (0.73%) Windows
3 1 (0.24%) Linux
3 1 (0.24%) Unix
Processes & Methodologies
1 167 (40.53%) Analytics
2 157 (38.11%) Agile
3 142 (34.47%) ETL
4 121 (29.37%) Data Engineering
5 120 (29.13%) Business Intelligence
6 112 (27.18%) Data Architecture
7 102 (24.76%) Mentoring
8 100 (24.27%) DevOps
9 94 (22.82%) Data Integration
10 92 (22.33%) Data Governance
11 91 (22.09%) CI/CD
12 90 (21.84%) AI
13 83 (20.15%) Problem-Solving
14 75 (18.20%) Data Pipeline
15 74 (17.96%) Data Management
16 73 (17.72%) Continuous Improvement
17 71 (17.23%) Decision-Making
18 58 (14.08%) Migration
19 55 (13.35%) Coaching
20 54 (13.11%) Visualisation
Programming Languages
1 198 (48.06%) SQL
2 139 (33.74%) Python
3 41 (9.95%) Data Analysis Expressions
4 33 (8.01%) Java
5 31 (7.52%) JavaScript
6 29 (7.04%) C#
7 21 (5.10%) TypeScript
8 20 (4.85%) Scala
9 18 (4.37%) Apex Code
10 12 (2.91%) PowerShell
11 11 (2.67%) R
12 9 (2.18%) T-SQL
13 5 (1.21%) PL/SQL
14 4 (0.97%) Fortran
14 4 (0.97%) Go
14 4 (0.97%) Kotlin
14 4 (0.97%) PHP
14 4 (0.97%) VBA
15 3 (0.73%) Bash
15 3 (0.73%) Swift
Qualifications
1 56 (13.59%) Degree
2 36 (8.74%) Computer Science Degree
3 23 (5.58%) Azure Certification
4 22 (5.34%) Microsoft Certification
5 20 (4.85%) AWS Certification
6 18 (4.37%) Security Cleared
7 16 (3.88%) SC Cleared
8 14 (3.40%) TOGAF Certification
9 12 (2.91%) AWS Certified Solutions Architect
9 12 (2.91%) Six Sigma Green Belt
10 9 (2.18%) Master's Degree
11 7 (1.70%) DBS Check
12 6 (1.46%) SnowPro
13 4 (0.97%) PMI Certification
13 4 (0.97%) PMP
14 3 (0.73%) CFA
14 3 (0.73%) ITIL Certification
15 2 (0.49%) CITP
15 2 (0.49%) PhD
16 1 (0.24%) SAP Certification
Quality Assurance & Compliance
1 50 (12.14%) Data Quality
2 32 (7.77%) Accessibility
3 21 (5.10%) GDPR
4 13 (3.16%) Actionable Recommendations
4 13 (3.16%) QA
5 3 (0.73%) HIPAA
6 2 (0.49%) ISO/IEC 27001
7 1 (0.24%) ISO 13485
7 1 (0.24%) P3O
7 1 (0.24%) PCI DSS
7 1 (0.24%) PMO
System Software
1 4 (0.97%) Docker
2 2 (0.49%) Firmware
Systems Management
1 19 (4.61%) Terraform
2 3 (0.73%) Kubernetes
3 2 (0.49%) Ansible
4 1 (0.24%) Grafana
4 1 (0.24%) Progress Chef
4 1 (0.24%) Prometheus
4 1 (0.24%) Puppet
Vendors
1 120 (29.13%) Microsoft
2 76 (18.45%) Databricks
3 28 (6.80%) Salesforce
4 22 (5.34%) Google
5 11 (2.67%) Informatica
6 10 (2.43%) SAP
7 9 (2.18%) Oracle
8 8 (1.94%) MuleSoft
9 6 (1.46%) IBM
9 6 (1.46%) ServiceNow
9 6 (1.46%) Talend
10 4 (0.97%) Salesforce Marketing Cloud
11 3 (0.73%) Murex
11 3 (0.73%) Sparx
12 2 (0.49%) Adobe
12 2 (0.49%) Alteryx
12 2 (0.49%) Conga
12 2 (0.49%) DocuSign
12 2 (0.49%) OutSystems
12 2 (0.49%) Samsung