Hybrid/Remote Metadata Job Trends

Metadata
UK > Work from Home

The table below provides summary statistics and salary benchmarking for remote or hybrid work requiring Metadata skills. It covers vacancies from the 6 months leading up to 18 September 2025, with comparisons to the same periods in the previous two years.

6 months to
18 Sep 2025
Same period 2024 Same period 2023
Rank 328 410 306
Rank change year-on-year +82 -104 +192
Permanent jobs citing Metadata 93 85 231
As % of all permanent jobs with a WFH option 0.57% 0.36% 0.94%
As % of the Database & Business Intelligence category 3.38% 1.74% 3.78%
Number of salaries quoted 58 64 152
10th Percentile £40,903 - £45,125
25th Percentile £50,848 £37,250 £55,375
Median annual salary (50th Percentile) £70,000 £60,000 £62,500
Median % change year-on-year +16.67% -4.00% -16.11%
75th Percentile £81,875 £80,625 £85,625
90th Percentile £92,250 £90,000 £101,066
UK median annual salary £63,425 £65,000 £65,000
% change year-on-year -2.42% - -7.14%

All Database and Business Intelligence Skills
Work from Home

Metadata falls under the Databases and Business Intelligence category. For comparison with the information above, the following table provides summary statistics for all permanent job vacancies with remote or hybrid options requiring database or business intelligence skills.

Permanent vacancies with a requirement for database or business intelligence skills 2,748 4,878 6,119
As % of all permanent jobs with a WFH option 16.86% 20.81% 24.92%
Number of salaries quoted 1,917 3,294 5,119
10th Percentile £35,500 £39,075 £40,000
25th Percentile £46,250 £48,750 £49,000
Median annual salary (50th Percentile) £63,500 £67,500 £62,500
Median % change year-on-year -5.93% +8.00% +4.17%
75th Percentile £82,751 £95,000 £78,750
90th Percentile £114,250 £140,000 £95,000
UK median annual salary £60,000 £63,500 £62,500
% change year-on-year -5.51% +1.60% +4.17%

Metadata
Trend for Jobs with a WFH Option

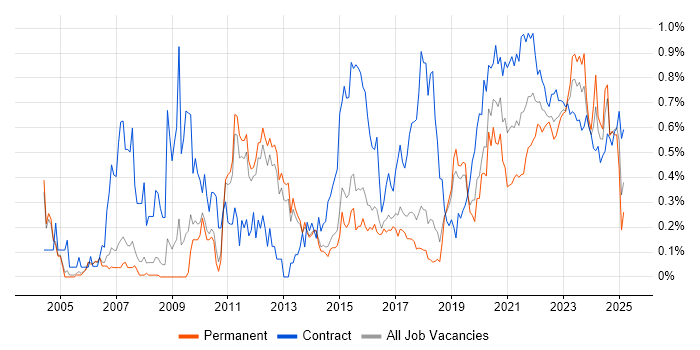
Job vacancies with remote working options citing Metadata as a proportion of all IT jobs advertised.

Metadata trend for jobs with Hybrid/Remote/WFH options

Metadata
Salary Trend for Jobs with Hybrid Work Options

Salary distribution trend for jobs with remote work options citing Metadata.

Salary distribution trend for jobs with remote work options citing Metadata

Metadata
Salary Histogram for Jobs with a WFH Option

Salary distribution for jobs with remote working options citing Metadata over the 6 months to 18 September 2025.

Metadata salary histogram for jobs with a WFH option

Metadata
Co-occurring Skills and Capabilities with WFH Options by Category

The follow tables expand on the table above by listing co-occurrences grouped by category. The same employment type, locality and period is covered with up to 20 co-occurrences shown in each of the following categories:

Application Platforms
1 13 (13.98%) Microsoft Exchange
2 8 (8.60%) SharePoint
3 5 (5.38%) CMS
4 4 (4.30%) Apache Spark
5 3 (3.23%) nginx
6 2 (2.15%) Confluence
6 2 (2.15%) Drupal
6 2 (2.15%) EPiServer
6 2 (2.15%) Umbraco
7 1 (1.08%) SharePoint Server
Applications
1 4 (4.30%) Microsoft Excel
2 2 (2.15%) Photoshop
3 1 (1.08%) Microsoft Office
Business Applications
1 5 (5.38%) Dynamics CRM
2 3 (3.23%) Sparx Enterprise Architect
Cloud Services
1 43 (46.24%) Azure
2 36 (38.71%) Power Platform
3 21 (22.58%) AWS
4 16 (17.20%) SaaS
5 13 (13.98%) Azure Data Factory
6 12 (12.90%) GCP
7 9 (9.68%) Microsoft Purview
8 8 (8.60%) Microsoft 365
9 7 (7.53%) Azure Synapse Analytics
10 6 (6.45%) Dynamics 365
10 6 (6.45%) Snowflake
11 5 (5.38%) Collibra
11 5 (5.38%) Microsoft Copilot
11 5 (5.38%) npm
11 5 (5.38%) Power Automate
11 5 (5.38%) PowerApps
12 4 (4.30%) Google Analytics
13 3 (3.23%) Amazon EC2
13 3 (3.23%) Azure DevOps
13 3 (3.23%) GitHub
Communications & Networking
1 1 (1.08%) Broadband
Database & Business Intelligence
1 30 (32.26%) Power BI
2 18 (19.35%) Data Warehouse
2 18 (19.35%) SQL Server
3 17 (18.28%) Data Hub
4 15 (16.13%) Data Lake
5 13 (13.98%) SQL CLR
5 13 (13.98%) SQL Server Analysis Services
5 13 (13.98%) SQL Server Reporting Services
6 10 (10.75%) Tableau
7 9 (9.68%) Azure SQL Data Warehouse
8 8 (8.60%) Data Vault
9 7 (7.53%) Metadata Repository
10 6 (6.45%) Amazon Redshift
11 4 (4.30%) Apache Hive
11 4 (4.30%) Big Data
11 4 (4.30%) BigQuery
11 4 (4.30%) Enterprise Data Warehouse
11 4 (4.30%) Hadoop
11 4 (4.30%) Relational Database
11 4 (4.30%) SAP BW
Development Applications
1 10 (10.75%) JIRA
2 5 (5.38%) Git
2 5 (5.38%) gulp
2 5 (5.38%) webpack
3 3 (3.23%) Babel
3 3 (3.23%) ERwin
4 2 (2.15%) ER Studio
4 2 (2.15%) Grunt
General
1 38 (40.86%) Finance
2 26 (27.96%) Social Skills
3 17 (18.28%) Inclusion and Diversity
4 16 (17.20%) Back Office
5 15 (16.13%) Analytical Skills
6 9 (9.68%) Public Sector
7 8 (8.60%) Law
8 5 (5.38%) Banking
8 5 (5.38%) Manufacturing
9 4 (4.30%) Legal
9 4 (4.30%) Marketing
10 3 (3.23%) Fire and Rescue
10 3 (3.23%) Publishing
11 2 (2.15%) Music Industry
11 2 (2.15%) Presentation Skills
12 1 (1.08%) Electronics
12 1 (1.08%) Games
12 1 (1.08%) Telecoms
Job Titles
1 21 (22.58%) Developer
1 21 (22.58%) Senior
2 19 (20.43%) Architect
2 19 (20.43%) Data Architect
3 15 (16.13%) Lead
3 15 (16.13%) Senior Developer
4 14 (15.05%) Data Engineer
5 13 (13.98%) Microsoft Developer
5 13 (13.98%) SaaS Developer
5 13 (13.98%) Senior Microsoft Developer
5 13 (13.98%) Senior SQL Developer
5 13 (13.98%) SQL Developer
6 6 (6.45%) Senior Data Engineer
7 5 (5.38%) Front-End Developer (Client-Side Developer)
7 5 (5.38%) Support Officer
7 5 (5.38%) Systems Support
8 4 (4.30%) Analyst
8 4 (4.30%) Cloud Architect
8 4 (4.30%) Software Developer
8 4 (4.30%) Test Engineer
Libraries, Frameworks & Software Standards
1 5 (5.38%) CSS
1 5 (5.38%) HTML
1 5 (5.38%) Node.js
1 5 (5.38%) Sass
2 4 (4.30%) EDI
3 3 (3.23%) OAuth
3 3 (3.23%) React
3 3 (3.23%) REST
3 3 (3.23%) Svelte
3 3 (3.23%) Vue
4 2 (2.15%) CSS3
4 2 (2.15%) HTML5
4 2 (2.15%) PySpark
4 2 (2.15%) Redux
4 2 (2.15%) Regular Expression
4 2 (2.15%) RESTful
4 2 (2.15%) XML
5 1 (1.08%) .NET
5 1 (1.08%) ARM Templates
5 1 (1.08%) JSON
Miscellaneous
1 13 (13.98%) Private Cloud
2 11 (11.83%) Management Information System
3 6 (6.45%) Data Structures
3 6 (6.45%) Reference Data
3 6 (6.45%) Smart City
4 5 (5.38%) Algorithms
5 4 (4.30%) Blog
5 4 (4.30%) Legacy Systems
5 4 (4.30%) Product Ownership
6 3 (3.23%) Hybrid Cloud
6 3 (3.23%) Operational Technology
6 3 (3.23%) Self-Motivation
7 2 (2.15%) Acoustics
7 2 (2.15%) Data Centre
7 2 (2.15%) Graphic Design
8 1 (1.08%) NHS
8 1 (1.08%) Over-the-Top Content
8 1 (1.08%) Semantic Web
8 1 (1.08%) Social Media
8 1 (1.08%) Taxonomies
Operating Systems
1 5 (5.38%) Linux
2 3 (3.23%) Ubuntu
3 2 (2.15%) Mac OS
3 2 (2.15%) Unix
Processes & Methodologies
1 38 (40.86%) Data Modelling
2 36 (38.71%) Business Intelligence
3 29 (31.18%) Migration
4 27 (29.03%) Data Governance
4 27 (29.03%) Data Management
5 26 (27.96%) Metadata Management
6 25 (26.88%) Data Privacy
7 24 (25.81%) Analytics
7 24 (25.81%) Data Architecture
8 22 (23.66%) Data Science
8 22 (23.66%) ETL
9 17 (18.28%) Performance Tuning
10 16 (17.20%) Agile
10 16 (17.20%) Problem-Solving
11 15 (16.13%) Computer Science
12 14 (15.05%) High Availability
12 14 (15.05%) Statistics
13 13 (13.98%) Data Transformation
13 13 (13.98%) Refactoring
13 13 (13.98%) Wealth Management
Programming Languages
1 38 (40.86%) SQL
2 18 (19.35%) Python
3 14 (15.05%) T-SQL
4 8 (8.60%) Scala
5 6 (6.45%) Java
6 5 (5.38%) JavaScript
7 4 (4.30%) PL/SQL
7 4 (4.30%) R
8 2 (2.15%) Bash
8 2 (2.15%) C
8 2 (2.15%) C++
8 2 (2.15%) Fortran
9 1 (1.08%) Bicep
9 1 (1.08%) C#
9 1 (1.08%) Shell Script
9 1 (1.08%) SPARQL
Qualifications
1 16 (17.20%) Degree
2 9 (9.68%) Security Cleared
3 8 (8.60%) SC Cleared
4 6 (6.45%) Master's Degree
5 4 (4.30%) Computer Science Degree
5 4 (4.30%) ISTQB
6 3 (3.23%) CITP
7 2 (2.15%) Microsoft Certification
7 2 (2.15%) PhD
7 2 (2.15%) TOGAF Certification
8 1 (1.08%) Azure Certification
Quality Assurance & Compliance
1 26 (27.96%) Data Quality
2 8 (8.60%) Accessibility
2 8 (8.60%) GDPR
3 3 (3.23%) California Consumer Privacy Act
4 2 (2.15%) QA
5 1 (1.08%) Cyber Essentials
5 1 (1.08%) Dublin Core
System Software
1 13 (13.98%) VMware Infrastructure
2 4 (4.30%) HDFS
Systems Management
1 13 (13.98%) Failover Clustering
2 1 (1.08%) Terraform
Vendors
1 33 (35.48%) Microsoft
2 13 (13.98%) Google
2 13 (13.98%) Oracle
2 13 (13.98%) VMware
3 10 (10.75%) Databricks
4 9 (9.68%) Informatica
5 7 (7.53%) SAP
6 5 (5.38%) ServiceNow
7 4 (4.30%) Teradata
8 3 (3.23%) Sparx
9 2 (2.15%) Salesforce
10 1 (1.08%) Alteryx
10 1 (1.08%) Talend