Architect Contract Job Trends in Northampton

Architect
Northamptonshire > Northampton

The median Architect daily rate in Northampton is £465, according to job vacancies posted in the 6 months leading up to 21 September 2025.

The table below provides contractor rate benchmarking and summary statistics, comparing them to the same period in the previous two years.

6 months to
21 Sep 2025
Same period 2024 Same period 2023
Rank 18 3 1
Rank change year-on-year -15 -2 +25
Contract jobs requiring an Architect 32 52 33
As % of all contract jobs advertised in Northampton 11.64% 23.11% 28.45%
As % of the Job Titles category 12.12% 24.76% 30.28%
Number of daily rates quoted 31 44 24
10th Percentile £405 - £503
25th Percentile £439 £445 £522
Median daily rate (50th Percentile) £465 £490 £534
Median % change year-on-year -5.01% -8.33% +23.47%
75th Percentile £513 £578 £578
90th Percentile £552 £622 £606
Northamptonshire median daily rate £473 £490 £534
% change year-on-year -3.44% -8.24% +9.54%

All Contract IT Job Vacancies
Northampton

For comparison with the information above, the following table provides summary statistics for all contract IT job vacancies in Northampton. Most job vacancies include a discernible job title that can be normalized. As such, the figures in the second row provide an indication of the number of contract jobs in our overall sample.

Contract vacancies in Northampton with a recognized job title 264 210 109
% of contract IT jobs with a recognized job title 96.00% 93.33% 93.97%
Number of daily rates quoted 239 166 82
10th Percentile £270 £355 £213
25th Percentile £343 £383 £400
Median daily rate (50th Percentile) £375 £445 £489
Median % change year-on-year -15.73% -9.00% +9.89%
75th Percentile £450 £550 £534
90th Percentile £525 £600 £586
Northamptonshire median daily rate £390 £445 £490
% change year-on-year -12.36% -9.18% +5.44%
Number of hourly rates quoted 4 0 1
Median hourly rate £21.39 - £14.52
Median % change year-on-year - - -5.28%
Northamptonshire median hourly rate £21.39 £12.22 £14.52
% change year-on-year +75.04% -15.84% -56.98%

Architect
Job Vacancy Trend in Northampton

Job postings that featured Architect in the job title as a proportion of all IT jobs advertised in Northampton.
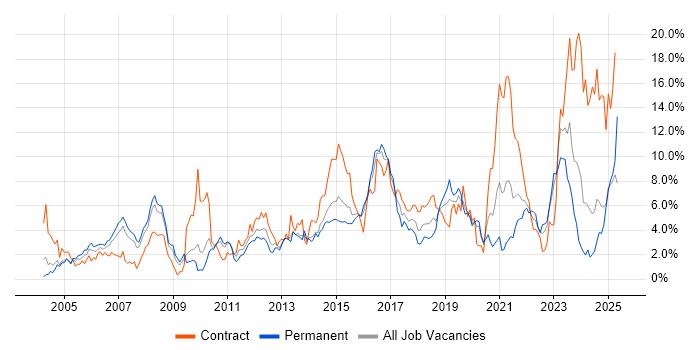
Job vacancy trend for Architect in Northampton

Architect
Daily Rate Trend in Northampton

Contractor daily rate distribution trend for Architect job vacancies in Northampton.

Contractor daily rate distribution trend for Architect job vacancies in Northampton

Architect
Daily Rate Histogram in Northampton

Daily rate distribution for jobs citing Architect in Northampton over the 6 months to 21 September 2025.

Daily rate histogram for Architect in Northampton

Architect Skill Set
Top 30 Co-occurring Skills and Capabilities in Northampton

For the 6 months to 21 September 2025, Architect contract job roles required the following skills and capabilities in order of popularity. The figures indicate the absolute number co-occurrences and as a proportion of all contract job ads across the Northampton region featuring Architect in the job title.

1 20 (62.50%) AWS
2 16 (50.00%) Banking
3 15 (46.88%) Roadmaps
4 14 (43.75%) Finance
5 13 (40.63%) Microservices
6 10 (31.25%) Migration
6 10 (31.25%) Java
6 10 (31.25%) Problem-Solving
7 9 (28.13%) GDPR
7 9 (28.13%) Integration Patterns
7 9 (28.13%) Azure
8 8 (25.00%) Salesforce
8 8 (25.00%) Agile
8 8 (25.00%) California Consumer Privacy Act
9 7 (21.88%) IT Strategy
9 7 (21.88%) Salesforce Service Cloud
9 7 (21.88%) Salesforce Sales Cloud
9 7 (21.88%) Marketing
9 7 (21.88%) Data Migration
9 7 (21.88%) Data Modelling
9 7 (21.88%) ETL
9 7 (21.88%) REST
10 6 (18.75%) Data Governance
10 6 (18.75%) Data Quality
10 6 (18.75%) Visualforce
10 6 (18.75%) Apex Code
10 6 (18.75%) SOAP
10 6 (18.75%) Middleware
10 6 (18.75%) Data Flow Diagram
10 6 (18.75%) Payment Gateway

Architect Skill Set
Co-occurring Skills and Capabilities in Northampton by Category

The follow tables expand on the table above by listing co-occurrences grouped by category. The same employment type, locality and period is covered with up to 20 co-occurrences shown in each of the following categories:

Application Platforms
1 1 (3.13%) Confluence
Applications
1 1 (3.13%) Microsoft Excel
1 1 (3.13%) Microsoft PowerPoint
Business Applications
1 6 (18.75%) Payment Gateway
2 1 (3.13%) Salesforce CRM
Cloud Services
1 20 (62.50%) AWS
2 9 (28.13%) Azure
3 7 (21.88%) Salesforce Sales Cloud
3 7 (21.88%) Salesforce Service Cloud
4 3 (9.38%) Amazon CloudWatch
4 3 (9.38%) Amazon Glacier
4 3 (9.38%) Amazon Kinesis
4 3 (9.38%) Amazon S3
4 3 (9.38%) AWS Lambda
4 3 (9.38%) Cloud Computing
4 3 (9.38%) GCP
4 3 (9.38%) Serverless
5 1 (3.13%) Amazon Neptune
5 1 (3.13%) Amazon SageMaker
5 1 (3.13%) Apigee
5 1 (3.13%) AWS CodePipeline
5 1 (3.13%) AWS Data Pipeline
5 1 (3.13%) Kong
5 1 (3.13%) Microsoft 365
5 1 (3.13%) Vertex AI
Communications & Networking
1 2 (6.25%) DMZ
1 2 (6.25%) Firewall
1 2 (6.25%) Internet
Database & Business Intelligence
1 3 (9.38%) DynamoDB
2 2 (6.25%) MongoDB
2 2 (6.25%) NoSQL
3 1 (3.13%) BigQuery
3 1 (3.13%) Tableau
Development Applications
1 5 (15.63%) Jenkins
2 2 (6.25%) Git
2 2 (6.25%) Gradle
2 2 (6.25%) Maven
3 1 (3.13%) GitLab
3 1 (3.13%) JIRA
General
1 16 (50.00%) Banking
2 14 (43.75%) Finance
3 7 (21.88%) Marketing
4 4 (12.50%) Social Skills
5 2 (6.25%) Analytical Skills
5 2 (6.25%) Presentation Skills
5 2 (6.25%) Public Sector
6 1 (3.13%) Retail
6 1 (3.13%) Retail Banking
Libraries, Frameworks & Software Standards
1 7 (21.88%) REST
2 6 (18.75%) Lightning Web Components
2 6 (18.75%) Middleware
2 6 (18.75%) SOAP
2 6 (18.75%) Visualforce
3 4 (12.50%) Kafka
3 4 (12.50%) RESTful
4 3 (9.38%) ActiveMQ
4 3 (9.38%) Web Services
5 2 (6.25%) LDAP
5 2 (6.25%) RAML
6 1 (3.13%) CrewAI
6 1 (3.13%) LangGraph
6 1 (3.13%) OAuth
6 1 (3.13%) OpenID
6 1 (3.13%) Semantic Kernel
6 1 (3.13%) Spring
6 1 (3.13%) Spring Boot
6 1 (3.13%) Swagger
Miscellaneous
1 5 (15.63%) Data Centre
2 4 (12.50%) Cloud Native
2 4 (12.50%) Product Ownership
3 3 (9.38%) Public Cloud
4 2 (6.25%) Algorithms
4 2 (6.25%) Management Information System
5 1 (3.13%) AI Agents
5 1 (3.13%) Enterprise Software
5 1 (3.13%) Smart City
Operating Systems
1 1 (3.13%) Mac OS
1 1 (3.13%) Windows
1 1 (3.13%) Windows 10
Processes & Methodologies
1 15 (46.88%) Roadmaps
2 13 (40.63%) Microservices
3 10 (31.25%) Migration
3 10 (31.25%) Problem-Solving
4 9 (28.13%) Integration Patterns
5 8 (25.00%) Agile
6 7 (21.88%) Data Migration
6 7 (21.88%) Data Modelling
6 7 (21.88%) ETL
6 7 (21.88%) IT Strategy
7 6 (18.75%) Architectural Design
7 6 (18.75%) Architecture Roadmap
7 6 (18.75%) Data Flow Diagram
7 6 (18.75%) Data Governance
7 6 (18.75%) Design Patterns
7 6 (18.75%) Strategic Roadmap
7 6 (18.75%) Technical Leadership
7 6 (18.75%) Technology Strategy
8 5 (15.63%) High Availability
8 5 (15.63%) Mentoring
Programming Languages
1 10 (31.25%) Java
2 6 (18.75%) Apex Code
3 2 (6.25%) Python
3 2 (6.25%) SQL
Qualifications
1 4 (12.50%) Computer Science Degree
1 4 (12.50%) Degree
1 4 (12.50%) Master's Degree
1 4 (12.50%) Security Cleared
2 3 (9.38%) BPSS Clearance
3 2 (6.25%) TOGAF Certification
4 1 (3.13%) AWS Certification
4 1 (3.13%) AWS Certified Solutions Architect
4 1 (3.13%) Citrix Certification
4 1 (3.13%) MCP
4 1 (3.13%) Microsoft Certification
4 1 (3.13%) SC Cleared
Quality Assurance & Compliance
1 9 (28.13%) GDPR
2 8 (25.00%) California Consumer Privacy Act
3 6 (18.75%) Data Quality
4 2 (6.25%) NIST
5 1 (3.13%) ISO/IEC 27001
System Software
1 4 (12.50%) Docker
2 1 (3.13%) VMware Infrastructure
Systems Management
1 1 (3.13%) Kubernetes
1 1 (3.13%) SCCM
Vendors
1 8 (25.00%) Salesforce
2 3 (9.38%) Microsoft
3 1 (3.13%) Citrix
3 1 (3.13%) MuleSoft
3 1 (3.13%) Splunk
3 1 (3.13%) VMware