Analyst Jobs in Oxford

Analyst
Oxfordshire > Oxford

The median Analyst salary in Oxford is £41,000 per year according to job vacancies posted during the 6 months to 18 May 2024.

The first table below provides salary benchmarking and summary statistics including a comparison to same period in the previous 2 years.

6 months to
18 May 2024
Same period 2023 Same period 2022
Rank 29 24 35
Rank change year-on-year -5 +11 +7
Permanent jobs requiring an Analyst 41 29 31
As % of all permanent jobs advertised in Oxford 6.30% 6.52% 6.03%
As % of the Job Titles category 6.60% 7.71% 6.30%
Number of salaries quoted 15 21 18
10th Percentile £31,400 £26,500 £25,815
25th Percentile £35,375 £29,750 £29,375
Median annual salary (50th Percentile) £41,000 £38,500 £45,000
Median % change year-on-year +6.49% -14.44% +5.88%
75th Percentile £50,000 £54,250 £58,750
90th Percentile £59,500 £67,500 £60,750
Oxfordshire median annual salary £41,000 £35,000 £42,500
% change year-on-year +17.14% -17.65% +2.41%

All Permanent IT Job Vacancies
Oxford

The following table is for comparison with the above and includes summary statistics for all permanent IT job vacancies advertised in Oxford. Most job vacancies include a discernible job title that can be normalized. As such, the figures in the second row provide an indication of the number of permanent jobs in our overall sample.

Permanent vacancies in Oxford with a recognized job title 621 376 492
% of permanent jobs with a recognized job title 95.39% 84.49% 95.72%
Number of salaries quoted 459 265 293
10th Percentile £30,000 £26,750 £30,212
25th Percentile £40,000 £37,500 £36,250
Median annual salary (50th Percentile) £52,500 £54,000 £60,000
Median % change year-on-year -2.78% -10.00% +20.00%
75th Percentile £64,750 £68,750 £68,750
90th Percentile £75,000 £85,000 £80,000
Oxfordshire median annual salary £47,500 £50,250 £52,500
% change year-on-year -5.47% -4.29% +5.00%

Analyst
Job Vacancy Trend in Oxford

Job postings that featured Analyst in the job title as a proportion of all IT jobs advertised in Oxford.
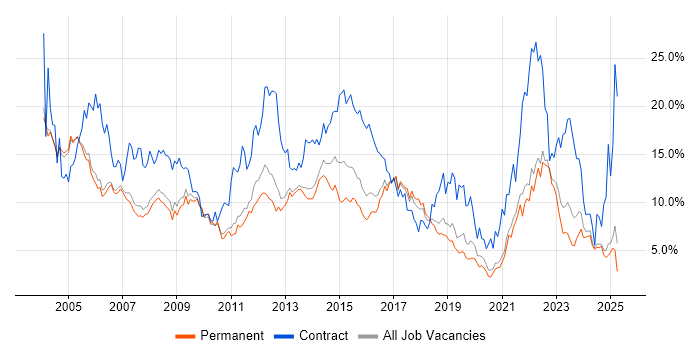
Job vacancy trend for Analyst in Oxford

Analyst
Salary Trend in Oxford

3-month moving average salary quoted in jobs citing Analyst in Oxford.

Salary trend for Analyst in Oxford

Analyst
Salary Histogram in Oxford

Salary distribution for jobs citing Analyst in Oxford over the 6 months to 18 May 2024.

Salary histogram for Analyst in Oxford

Analyst Skill Set
Top 30 Co-occurring Skills and Capabilities in Oxford

For the 6 months to 18 May 2024, Analyst job roles required the following skills and capabilities in order of popularity. The figures indicate the absolute number co-occurrences and as a proportion of all permanent job ads across the Oxford region featuring Analyst in the job title.

1 25 (60.98%) Degree
2 20 (48.78%) Pharmaceutical
2 20 (48.78%) Analytical Skills
2 20 (48.78%) Neuroscience
2 20 (48.78%) Biopharmaceutical
3 17 (41.46%) Problem-Solving
4 15 (36.59%) Social Skills
4 15 (36.59%) ERP
5 14 (34.15%) Project Delivery
5 14 (34.15%) Continuous Improvement
6 13 (31.71%) Microsoft Excel
6 13 (31.71%) Sarbanes-Oxley
7 12 (29.27%) Project Management
7 12 (29.27%) Microsoft
7 12 (29.27%) QA
8 11 (26.83%) Management Information System
8 11 (26.83%) Finance
8 11 (26.83%) Scenario Testing
8 11 (26.83%) Virtual Team
8 11 (26.83%) Tech Ops
9 10 (24.39%) Manufacturing
10 8 (19.51%) Presentation Skills
11 7 (17.07%) Customer Service
11 7 (17.07%) Legal
11 7 (17.07%) SAP
11 7 (17.07%) Internal Audit
12 6 (14.63%) GxP
13 5 (12.20%) Business Intelligence
13 5 (12.20%) PRINCE2
13 5 (12.20%) SQL

Analyst Skill Set
Co-occurring Skills and Capabilities in Oxford by Category

The follow tables expand on the table above by listing co-occurrences grouped by category. The same employment type, locality and period is covered with up to 20 co-occurrences shown in each of the following categories:

Application Platforms
1 1 (2.44%) SharePoint
Applications
1 13 (31.71%) Microsoft Excel
2 2 (4.88%) Microsoft Office
2 2 (4.88%) Microsoft Project
3 1 (2.44%) MS Visio
Business Applications
1 1 (2.44%) NetSuite
Cloud Services
1 4 (9.76%) Power Platform
2 3 (7.32%) Azure
3 2 (4.88%) Microsoft 365
4 1 (2.44%) AWS
4 1 (2.44%) Azure Sentinel
4 1 (2.44%) Salesforce Sales Cloud
4 1 (2.44%) Salesforce Service Cloud
4 1 (2.44%) WhatsApp
Communications & Networking
1 4 (9.76%) Internet
2 2 (4.88%) Firewall
3 1 (2.44%) SD-WAN
3 1 (2.44%) WAN
Database & Business Intelligence
1 4 (9.76%) Power BI
2 1 (2.44%) Metadata
2 1 (2.44%) MongoDB
2 1 (2.44%) MySQL
2 1 (2.44%) Power Query
2 1 (2.44%) Spotfire
2 1 (2.44%) SQL Server
2 1 (2.44%) Tableau
General
1 20 (48.78%) Analytical Skills
1 20 (48.78%) Pharmaceutical
2 15 (36.59%) Social Skills
3 11 (26.83%) Finance
4 10 (24.39%) Manufacturing
5 8 (19.51%) Presentation Skills
6 7 (17.07%) Legal
7 4 (9.76%) Public Sector
8 2 (4.88%) Electronics
9 1 (2.44%) Influencing Skills
9 1 (2.44%) Marketing
Miscellaneous
1 20 (48.78%) Biopharmaceutical
2 11 (26.83%) Management Information System
2 11 (26.83%) Virtual Team
3 4 (9.76%) Cyber Threat
4 3 (7.32%) Enterprise Software
5 2 (4.88%) Algorithms
5 2 (4.88%) Life Science
5 2 (4.88%) Molecular Biology
6 1 (2.44%) Genomics
6 1 (2.44%) Self-Motivation
6 1 (2.44%) Video Conferencing
Operating Systems
1 1 (2.44%) Linux
1 1 (2.44%) Windows
1 1 (2.44%) Windows 10
1 1 (2.44%) Windows Server
1 1 (2.44%) Windows Server 2016
1 1 (2.44%) Windows Server 2019
Processes & Methodologies
1 20 (48.78%) Neuroscience
2 17 (41.46%) Problem-Solving
3 15 (36.59%) ERP
4 14 (34.15%) Continuous Improvement
4 14 (34.15%) Project Delivery
5 12 (29.27%) Project Management
6 11 (26.83%) Scenario Testing
6 11 (26.83%) Tech Ops
7 7 (17.07%) Customer Service
7 7 (17.07%) Internal Audit
8 5 (12.20%) Business Intelligence
8 5 (12.20%) Data Management
8 5 (12.20%) PRINCE2
9 4 (9.76%) Agile
9 4 (9.76%) ITIL
10 3 (7.32%) Analytics
10 3 (7.32%) Coaching
10 3 (7.32%) Data Science
10 3 (7.32%) Decision-Making
10 3 (7.32%) Problem Management
Programming Languages
1 5 (12.20%) SQL
2 3 (7.32%) Python
3 2 (4.88%) R
Qualifications
1 25 (60.98%) Degree
2 2 (4.88%) PMI Certification
2 2 (4.88%) PMP
3 1 (2.44%) ACCA
3 1 (2.44%) CIMA
3 1 (2.44%) Computer Science Degree
3 1 (2.44%) Master's Degree
Quality Assurance & Compliance
1 13 (31.71%) Sarbanes-Oxley
2 12 (29.27%) QA
3 6 (14.63%) GxP
4 3 (7.32%) Data Quality
4 3 (7.32%) PMO
5 1 (2.44%) GAAP
System Software
1 2 (4.88%) VMware Infrastructure
2 1 (2.44%) Active Directory
Systems Management
1 1 (2.44%) ZENworks
Vendors
1 12 (29.27%) Microsoft
2 7 (17.07%) SAP
3 2 (4.88%) VMware
4 1 (2.44%) Alteryx
4 1 (2.44%) Salesforce
4 1 (2.44%) Talend