.NET Job Trends in Sheffield

Microsoft .NET (dotNet)
South Yorkshire > Sheffield

The table below provides summary statistics and salary benchmarking for jobs advertised in Sheffield requiring .NET skills. It covers permanent job vacancies from the 6 months leading up to 11 September 2026, with comparisons to the same periods in the previous two years.

6 months to
11 Sep 2026
Same period 2025 Same period 2024
Rank 44 25 17
Rank change year-on-year -19 -8 +21
Permanent jobs citing .NET 27 22 65
As % of all permanent jobs in Sheffield 2.53% 5.58% 7.51%
As % of the Libraries, Frameworks & Software Standards category 31.03% 43.14% 46.43%
Number of salaries quoted 26 22 35
10th Percentile £43,125 £25,000 £32,000
25th Percentile £46,225 £38,750 £38,125
Median annual salary (50th Percentile) £55,000 £48,750 £55,000
Median % change year-on-year +12.82% -11.36% -
75th Percentile £60,000 £65,938 £65,000
90th Percentile £80,750 £84,400 £72,500
South Yorkshire median annual salary £55,000 £45,000 £53,750
% change year-on-year +22.22% -16.28% -4.44%

All Software Libraries and Frameworks
Sheffield

.NET falls under the Software Libraries and Frameworks category. For comparison with the information above, the following table provides summary statistics for all permanent job vacancies requiring technical specification, industry standards, software libraries and framework skills in Sheffield.

Permanent vacancies with a requirement for technical specification, industry standards, software libraries and framework skills 87 51 140
As % of all permanent jobs advertised in Sheffield 8.16% 12.94% 16.18%
Number of salaries quoted 84 46 75
10th Percentile £38,850 £26,625 £29,850
25th Percentile £49,063 £38,500 £36,875
Median annual salary (50th Percentile) £65,000 £60,000 £52,500
Median % change year-on-year +8.33% +14.29% -4.55%
75th Percentile £82,500 £76,875 £65,000
90th Percentile £85,000 £86,250 £71,500
South Yorkshire median annual salary £55,000 £60,000 £52,500
% change year-on-year -8.33% +14.29% -4.55%

.NET
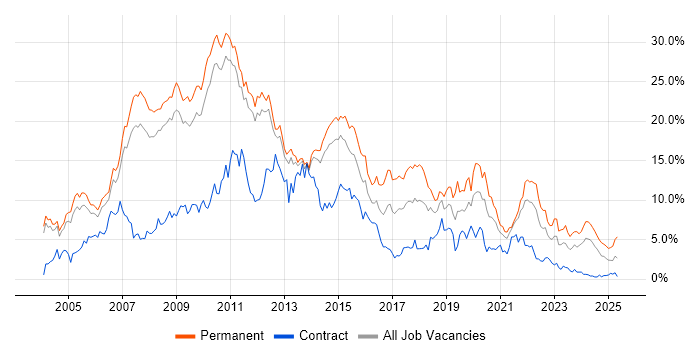
Job Vacancy Trend in Sheffield

Historical trend showing the proportion of permanent IT job postings citing .NET relative to all permanent IT jobs advertised in Sheffield.

.NET job vacancy trend in Sheffield

.NET
Salary Trend in Sheffield

Salary distribution trend for jobs in Sheffield citing .NET.

Salary distribution trend for jobs in Sheffield citing .NET

.NET
Salary Histogram in Sheffield

Salary distribution for jobs citing .NET in Sheffield over the 6 months to 11 September 2026.

Salary histogram for .NET in Sheffield

.NET
Co-Occurring Skills & Capabilities in Sheffield by Category

The following tables expand on the one above by listing co-occurrences grouped by category. They cover the same employment type, locality and period, with up to 20 co-occurrences shown in each category:

Application Platforms
1 2 (7.41%) SharePoint
2 1 (3.70%) Confluence
2 1 (3.70%) SharePoint Server
Cloud Services
1 19 (70.37%) Azure
2 8 (29.63%) Azure DevOps
3 5 (18.52%) Serverless
4 4 (14.81%) AWS
4 4 (14.81%) Azure AI
4 4 (14.81%) Google Play
5 3 (11.11%) Azure Functions
6 2 (7.41%) Amazon EC2
6 2 (7.41%) Amazon EMR
6 2 (7.41%) AWS Lambda
6 2 (7.41%) Dynamics 365
6 2 (7.41%) GCP
6 2 (7.41%) Power Automate
6 2 (7.41%) Power Platform
6 2 (7.41%) PowerApps
7 1 (3.70%) Azure Cosmos DB
7 1 (3.70%) Entra ID
7 1 (3.70%) GitHub
7 1 (3.70%) GitHub Actions
Database & Business Intelligence
1 5 (18.52%) Azure SQL Database
2 4 (14.81%) MongoDB
3 3 (11.11%) SQL Server
4 2 (7.41%) Data Warehouse
4 2 (7.41%) Power BI
4 2 (7.41%) Power Query
4 2 (7.41%) Relational Database
4 2 (7.41%) Spark SQL
Development Applications
1 5 (18.52%) Git
2 3 (11.11%) JIRA
3 2 (7.41%) Visual Studio
4 1 (3.70%) Jenkins
4 1 (3.70%) Sonatype Nexus
General
1 3 (11.11%) Public Sector
1 3 (11.11%) Social Skills
1 3 (11.11%) Tech for Good
2 2 (7.41%) Analytical Skills
3 1 (3.70%) Finance
3 1 (3.70%) Games
Job Titles
1 16 (59.26%) Developer
2 10 (37.04%) .NET Developer
3 9 (33.33%) C# Developer
4 8 (29.63%) Software Engineer
5 5 (18.52%) .NET Software Engineer
5 5 (18.52%) C# .NET Developer
5 5 (18.52%) Full-Stack Engineer
5 5 (18.52%) Full-Stack Software Engineer
6 4 (14.81%) Mid Level C# .NET Developer
6 4 (14.81%) Mid Level C# Developer
6 4 (14.81%) Mid-Level .NET Developer
7 3 (11.11%) C# Software Developer
7 3 (11.11%) Lead
7 3 (11.11%) Lead C# Developer
7 3 (11.11%) Lead Developer
7 3 (11.11%) Lead Software Developer
7 3 (11.11%) Software Developer
8 2 (7.41%) Data Engineer
8 2 (7.41%) Power Platform Developer
9 1 (3.70%) Azure Developer
Libraries, Frameworks & Software Standards
1 5 (18.52%) .NET Core
1 5 (18.52%) ASP.NET
1 5 (18.52%) ASP.NET Core
1 5 (18.52%) RESTful
2 4 (14.81%) Blazor
2 4 (14.81%) ML.NET
2 4 (14.81%) React
3 3 (11.11%) Next.js
4 2 (7.41%) CSS
4 2 (7.41%) HTML
4 2 (7.41%) HTML5 Canvas
4 2 (7.41%) JSON
4 2 (7.41%) PySpark
5 1 (3.70%) .NET Framework
5 1 (3.70%) Node.js
5 1 (3.70%) Terraform
Miscellaneous
1 4 (14.81%) iPhone
1 4 (14.81%) Mobile App
2 2 (7.41%) Data Structures
2 2 (7.41%) Hybrid Cloud
2 2 (7.41%) Legacy Systems
3 1 (3.70%) 3D Graphics
3 1 (3.70%) Driving Licence
3 1 (3.70%) Legacy Applications
Operating Systems
1 4 (14.81%) Android
Processes & Methodologies
1 15 (55.56%) Agile
2 13 (48.15%) DevOps
2 13 (48.15%) Full-Stack Development
3 11 (40.74%) CI/CD
4 9 (33.33%) Software Engineering
5 4 (14.81%) AI
5 4 (14.81%) Business Intelligence
5 4 (14.81%) Continuous Improvement
5 4 (14.81%) Machine Learning
5 4 (14.81%) Multithreading
6 3 (11.11%) API Design
6 3 (11.11%) Coaching
6 3 (11.11%) Continuous Integration
6 3 (11.11%) Decision-Making
6 3 (11.11%) Mentoring
6 3 (11.11%) Microservices
6 3 (11.11%) Problem-Solving
6 3 (11.11%) Technical Leadership
6 3 (11.11%) Test Automation
6 3 (11.11%) User Experience
Programming Languages
1 26 (96.30%) C#
2 12 (44.44%) SQL
3 10 (37.04%) JavaScript
4 3 (11.11%) C++
4 3 (11.11%) Java
4 3 (11.11%) VB.NET
5 2 (7.41%) Data Analysis Expressions
5 2 (7.41%) T-SQL
6 1 (3.70%) Bicep
6 1 (3.70%) PowerShell
6 1 (3.70%) Python
Quality Assurance & Compliance
1 2 (7.41%) Data Quality
1 2 (7.41%) QA
System Software
1 2 (7.41%) Docker
2 1 (3.70%) Active Directory
Systems Management
1 2 (7.41%) Kubernetes
2 1 (3.70%) Ansible
Vendors
1 8 (29.63%) Microsoft
2 4 (14.81%) Google