Node.js Developer
Lancashire > Blackpool
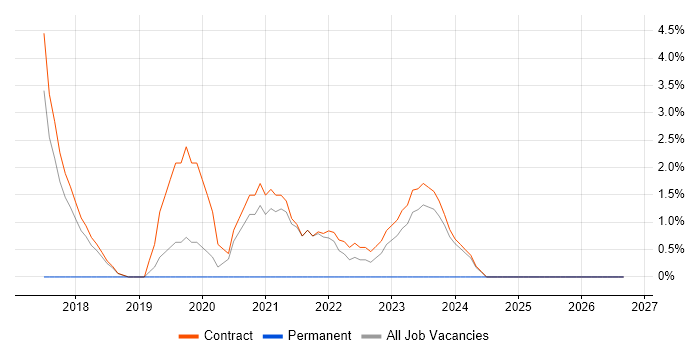
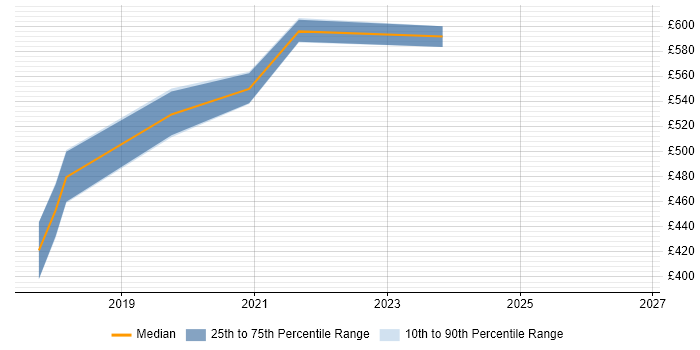
The median Node.js Developer daily rate in Blackpool is £400, according to job vacancies posted in the 6 months leading up to 14 October 2026.
The table below compares current contractor rates and summary statistics with the previous two years.
|
|
6 months to
14 Oct 2026 |
Same period 2025 |
Same period 2024 |
| Rank |
22 |
- |
- |
| Rank change year-on-year |
- |
- |
- |
| Contract jobs requiring a Node.js Developer |
1 |
0 |
0 |
| As % of all contract jobs in Blackpool |
1.37% |
- |
- |
| As % of the Job Titles category |
1.43% |
- |
- |
| Number of daily rates quoted |
1 |
0 |
0 |
| Median daily rate (50th Percentile) |
£400 |
- |
- |
| Lancashire median daily rate |
£400 |
- |
- |
For comparison with the information above, the following table provides summary statistics for all contract IT job vacancies in Blackpool. Most job vacancies include a discernible job title that can be normalized. As such, the figures in the second row provide an indication of the number of contract jobs in our overall sample.
| Contract vacancies in Blackpool with a recognized job title |
70 |
20 |
23 |
| % of contract IT jobs with a recognized job title |
95.89% |
100.00% |
100.00% |
| Number of daily rates quoted |
35 |
12 |
12 |
| 10th Percentile |
£400 |
£174 |
- |
| 25th Percentile |
£563 |
£372 |
£259 |
| Median daily rate (50th Percentile) |
£575 |
£450 |
£293 |
| Median % change year-on-year |
+27.78% |
+53.85% |
-53.01% |
| 75th Percentile |
£638 |
£519 |
£532 |
| 90th Percentile |
£683 |
£534 |
£648 |
| Lancashire median daily rate |
£575 |
£500 |
£475 |
| % change year-on-year |
+15.00% |
+5.26% |
-9.52% |
| Number of hourly rates quoted |
16 |
2 |
1 |
| 10th Percentile |
£13.94 |
- |
- |
| 25th Percentile |
£14.06 |
- |
£26.25 |
| Median hourly rate |
£21.14 |
£18.87 |
£27.50 |
| Median % change year-on-year |
+12.03% |
-31.38% |
- |
| 75th Percentile |
- |
- |
£28.75 |
| 90th Percentile |
£40.00 |
- |
- |
| Lancashire median hourly rate |
£31.50 |
£47.12 |
£40.33 |
| % change year-on-year |
-33.15% |
+16.85% |
-12.68% |