Analyst Developer
Central London > City of London
As of 19 January 2026, there is not enough information available from job vacancies posted within the last 6 months to determine the median Analyst Developer daily rate in the City of London.
| 6 months to 19 Jan 2026 |
Same period 2025 | Same period 2024 | |
|---|---|---|---|
| Rank | - | 113 | 133 |
| Rank change year-on-year | - | +20 | +53 |
| Contract jobs requiring an Analyst Developer | 0 | 4 | 1 |
| As % of all contract jobs in the City of London | - | 0.21% | 0.041% |
| As % of the Job Titles category | - | 0.23% | 0.044% |
| Number of daily rates quoted | 0 | 4 | 1 |
| 10th Percentile | - | - | - |
| 25th Percentile | - | £211 | £763 |
| Median daily rate (50th Percentile) | - | £574 | £775 |
| Median % change year-on-year | - | -25.97% | - |
| 75th Percentile | - | £963 | £788 |
| 90th Percentile | - | - | - |
| Central London median daily rate | - | £535 | £775 |
| % change year-on-year | - | -30.97% | - |
All Contract IT Job Roles
City of London
For comparison with the information above, the following table provides summary statistics for all contract IT job vacancies in the City of London. Most job vacancies include a discernible job title that can be normalized. As such, the figures in the second row provide an indication of the number of contract jobs in our overall sample.
| Contract vacancies in the City of London with a recognized job title | 1,723 | 1,744 | 2,281 |
| % of contract IT jobs with a recognized job title | 94.15% | 93.11% | 94.14% |
| Number of daily rates quoted | 1,201 | 1,065 | 1,632 |
| 10th Percentile | £340 | £363 | £357 |
| 25th Percentile | £425 | £463 | £463 |
| Median daily rate (50th Percentile) | £525 | £575 | £574 |
| Median % change year-on-year | -8.70% | +0.22% | -0.22% |
| 75th Percentile | £675 | £685 | £688 |
| 90th Percentile | £775 | £788 | £788 |
| Central London median daily rate | £533 | £575 | £563 |
| % change year-on-year | -7.39% | +2.22% | -2.17% |
| Number of hourly rates quoted | 16 | 9 | 15 |
| 10th Percentile | £19.98 | £13.45 | £17.00 |
| 25th Percentile | £24.37 | £22.00 | £20.09 |
| Median hourly rate | £31.00 | £32.50 | £24.00 |
| Median % change year-on-year | -4.62% | +35.42% | -26.15% |
| 75th Percentile | £42.65 | £112.00 | £42.38 |
| 90th Percentile | £50.63 | £117.10 | £63.75 |
| Central London median hourly rate | £26.11 | £35.00 | £26.00 |
| % change year-on-year | -25.40% | +34.62% | -10.34% |
Analyst Developer
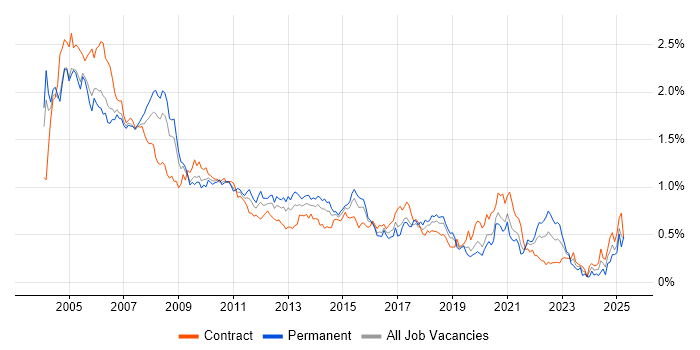
Job Vacancy Trend in the City of London
Historical trend showing the proportion of contract IT job postings featuring 'Analyst Developer' in the job title relative to all contract IT jobs advertised in the City of London.

Analyst Developer
Daily Rate Trend in the City of London
Contractor daily rate distribution trend for Analyst Developer job vacancies in the City of London.

Analyst Developer
Hourly Rate Trend in the City of London
Contractor hourly rate distribution trend for Analyst Developer job vacancies in the City of London.

