Confluence Contracts in Corsham

Confluence
Wiltshire > Corsham

The table below provides summary statistics for contract job vacancies advertised in Corsham requiring Confluence skills. It includes a benchmarking guide to the contractor rates offered in vacancies that cited Confluence over the 6 months leading up to 1 May 2025, comparing them to the same period in the previous two years.

6 months to
1 May 2025
Same period 2024 Same period 2023
Rank 18 17 37
Rank change year-on-year -1 +20 -9
Contract jobs citing Confluence 26 69 25
As % of all contract jobs advertised in Corsham 12.38% 12.39% 5.61%
As % of the Application Platforms category 74.29% 71.88% 29.07%
Number of daily rates quoted 26 66 24
10th Percentile £519 £463 £463
25th Percentile £531 £475 £509
Median daily rate (50th Percentile) £575 £538 £550
Median % change year-on-year +6.98% -2.27% +15.79%
75th Percentile £663 £700 £638
90th Percentile £710 - £703
Wiltshire median daily rate £575 £538 £550
% change year-on-year +6.98% -2.27% -

All Application Platform Skills
Corsham

Confluence falls under the Application Platforms category. For comparison with the information above, the following table provides summary statistics for all contract job vacancies requiring application platform skills in Corsham.

Contract vacancies with a requirement for application platform skills 35 96 86
As % of all contract IT jobs advertised in Corsham 16.67% 17.24% 19.28%
Number of daily rates quoted 35 85 80
10th Percentile £518 £430 £413
25th Percentile £531 £463 £463
Median daily rate (50th Percentile) £575 £525 £550
Median % change year-on-year +9.52% -4.55% +15.79%
75th Percentile £638 £700 £650
90th Percentile £695 - £725
Wiltshire median daily rate £575 £513 £550
% change year-on-year +12.20% -6.82% +15.79%

Confluence
Job Vacancy Trend in Corsham

Job postings citing Confluence as a proportion of all IT jobs advertised in Corsham.
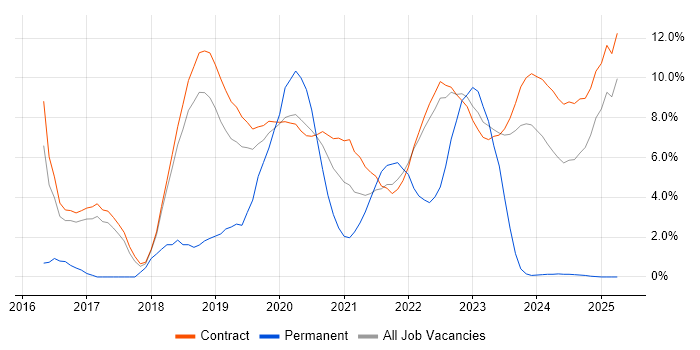
Job vacancy trend for Confluence in Corsham

Confluence
Contractor Daily Rate Trend in Corsham

3-month moving average daily rate quoted in jobs citing Confluence in Corsham.

Daily rate trend for Confluence in Corsham

Confluence
Daily Rate Histogram in Corsham

Daily rate distribution for jobs citing Confluence in Corsham over the 6 months to 1 May 2025.

Daily rate histogram for Confluence in Corsham

Confluence
Contractor Hourly Rate Trend in Corsham

3-month moving average hourly rates quoted in jobs citing Confluence in Corsham.

Hourly rate trend for Confluence in Corsham

Confluence
Co-occurring Skills and Capabilities in Corsham by Category

The follow tables expand on the table above by listing co-occurrences grouped by category. The same employment type, locality and period is covered with up to 20 co-occurrences shown in each of the following categories:

Application Platforms
1 5 (19.23%) Microsoft Exchange
2 4 (15.38%) Skype for Business
3 3 (11.54%) SharePoint
Applications
1 15 (57.69%) Microsoft Office
Business Applications
1 1 (3.85%) Remedy ITSM
Cloud Services
1 1 (3.85%) AWS
1 1 (3.85%) Azure
Communications & Networking
1 5 (19.23%) DHCP
1 5 (19.23%) DNS
1 5 (19.23%) Skype
2 4 (15.38%) Unified Communications
3 2 (7.69%) iSCSI
3 2 (7.69%) SAN
4 1 (3.85%) BGP
4 1 (3.85%) OSPF
4 1 (3.85%) VLAN
4 1 (3.85%) VoIP
Database & Business Intelligence
1 1 (3.85%) MySQL
1 1 (3.85%) SQL Server
Development Applications
1 26 (100.00%) JIRA
2 13 (50.00%) Bitbucket
3 8 (30.77%) Git
3 8 (30.77%) Jenkins
4 2 (7.69%) Atlassian Bamboo
General
1 19 (73.08%) Analytical Skills
2 18 (69.23%) Social Skills
3 15 (57.69%) Public Sector
4 3 (11.54%) Military
Job Titles
1 8 (30.77%) Virtualisation Engineer
2 3 (11.54%) DevOps Engineer
2 3 (11.54%) SC Cleared Software Engineer
2 3 (11.54%) Software Engineer
3 2 (7.69%) Linux Engineer
3 2 (7.69%) Test Engineer
4 1 (3.85%) Automation Engineer
4 1 (3.85%) Computer Engineer
4 1 (3.85%) Configuration Manager
4 1 (3.85%) Development Engineer
4 1 (3.85%) Infrastructure Engineer
4 1 (3.85%) Integration Engineer
4 1 (3.85%) Platform Engineer
4 1 (3.85%) Software Development Engineer
4 1 (3.85%) Telephony Engineer
4 1 (3.85%) Test and Integration Engineer
4 1 (3.85%) Test Manager
4 1 (3.85%) Voice Engineer
Libraries, Frameworks & Software Standards
1 8 (30.77%) Flash
1 8 (30.77%) REST
2 7 (26.92%) SOAP
3 1 (3.85%) .NET
3 1 (3.85%) .NET Core
3 1 (3.85%) .NET Framework
3 1 (3.85%) Elastic Stack
3 1 (3.85%) React
3 1 (3.85%) Vue
Miscellaneous
1 8 (30.77%) Clustering
2 7 (26.92%) PKI
3 1 (3.85%) CMDB
3 1 (3.85%) Data Centre
3 1 (3.85%) Management Information System
Operating Systems
1 16 (61.54%) Windows
1 16 (61.54%) Windows Server
2 9 (34.62%) Linux
3 5 (19.23%) Windows Server 2012
4 4 (15.38%) Windows 10
5 3 (11.54%) Windows Server 2016
6 2 (7.69%) VMS
Processes & Methodologies
1 25 (96.15%) Agile
2 21 (80.77%) Service Management
2 21 (80.77%) System Testing
3 19 (73.08%) NsoIT
4 16 (61.54%) Critical Thinking
4 16 (61.54%) Validation
5 14 (53.85%) Waterfall
6 11 (42.31%) Computer Science
6 11 (42.31%) Infrastructure Engineering
6 11 (42.31%) Problem-Solving
7 10 (38.46%) Configuration Management
8 9 (34.62%) Deployment Automation
9 8 (30.77%) High Availability
9 8 (30.77%) Power Management
10 7 (26.92%) Infrastructure Automation
10 7 (26.92%) Reverse Engineering
11 6 (23.08%) ITIL
11 6 (23.08%) Network Virtualisation
12 3 (11.54%) Information Security
12 3 (11.54%) Regression Testing
Programming Languages
1 12 (46.15%) PowerShell
2 9 (34.62%) Python
3 8 (30.77%) Bash
4 5 (19.23%) SQL
Qualifications
1 25 (96.15%) SC Cleared
1 25 (96.15%) Security Cleared
2 19 (73.08%) VMware Certified Professional (VCP)
3 16 (61.54%) Cisco Certification
3 16 (61.54%) Degree
4 10 (38.46%) CCNP
4 10 (38.46%) Master's Degree
5 8 (30.77%) CCNA
5 8 (30.77%) OCA
5 8 (30.77%) Oracle Certification
6 7 (26.92%) RHCA
6 7 (26.92%) RHCE
7 6 (23.08%) MCSA
7 6 (23.08%) Microsoft Certification
8 5 (19.23%) MCSE
9 4 (15.38%) DV Cleared
10 1 (3.85%) Computer Science Degree
10 1 (3.85%) ISTQB
10 1 (3.85%) ITIL Certification
System Software
1 20 (76.92%) VMware Infrastructure
2 8 (30.77%) VMware ESXi
2 8 (30.77%) VMware NSX
3 5 (19.23%) Active Directory
4 4 (15.38%) Hyper-V
5 3 (11.54%) Microsoft Virtual Server
5 3 (11.54%) Virtual Servers
6 1 (3.85%) Virtual Desktop
Systems Management
1 16 (61.54%) vCenter Server
2 8 (30.77%) Ansible
3 7 (26.92%) Progress Chef
3 7 (26.92%) Puppet
4 3 (11.54%) WSUS
5 2 (7.69%) PowerCLI
5 2 (7.69%) SCOM
6 1 (3.85%) OPNET
6 1 (3.85%) Terraform
Vendors
1 23 (88.46%) Atlassian
2 20 (76.92%) VMware
3 16 (61.54%) Cisco
4 10 (38.46%) Microsoft
5 8 (30.77%) Oracle
6 4 (15.38%) Veeam
7 1 (3.85%) BMC
7 1 (3.85%) Remedy
7 1 (3.85%) ServiceNow
7 1 (3.85%) SolarWinds