Oracle Contract Job Trends in Hampshire

Oracle
South East > Hampshire

The table below provides summary statistics for contract job vacancies advertised in Hampshire requiring knowledge or experience of Oracle products and/or services. It includes a benchmarking guide to contractor rates offered in vacancies that cited Oracle over the 6 months leading up to 1 November 2025, comparing them to the same period in the previous two years.

The figures below represent the IT contractor job market in general and are not representative of contractor rates within the Oracle Corporation.

6 months to
1 Nov 2025
Same period 2024 Same period 2023
Rank 22 45 48
Rank change year-on-year +23 +3 -4
Contract jobs citing Oracle 79 43 57
As % of all contract jobs in Hampshire 7.42% 3.75% 4.27%
As % of the Vendors category 16.29% 7.35% 7.64%
Number of daily rates quoted 64 34 38
10th Percentile £452 £420 £475
25th Percentile £484 £475 £513
Median daily rate (50th Percentile) £600 £560 £550
Median % change year-on-year +7.14% +1.82% -
75th Percentile £649 £684 £624
90th Percentile £650 £769 £725
South East median daily rate £525 £540 £550
% change year-on-year -2.78% -1.82% +4.76%
Number of hourly rates quoted 0 0 2
10th Percentile - - £46.92
25th Percentile - - £48.87
Median hourly rate - - £53.80
75th Percentile - - £57.04
90th Percentile - - £57.97
South East median hourly rate £81.00 £61.60 £55.31
% change year-on-year +31.49% +11.37% -28.86%

All Vendors
Hampshire

Oracle falls under the Vendor Products and Services category. For comparison with the information above, the following table provides summary statistics for all contract job vacancies requiring knowledge or experience of all vendor products and services in Hampshire.

Contract vacancies with a requirement for knowledge or experience of vendor products and services 485 585 746
As % of all contract IT jobs advertised in Hampshire 45.54% 51.00% 55.92%
Number of daily rates quoted 365 389 373
10th Percentile £292 £360 £263
25th Percentile £450 £463 £413
Median daily rate (50th Percentile) £525 £550 £525
Median % change year-on-year -4.55% +4.76% -
75th Percentile £600 £645 £625
90th Percentile £650 £719 £670
South East median daily rate £500 £515 £513
% change year-on-year -2.91% +0.49% +2.50%
Number of hourly rates quoted 22 24 57
10th Percentile - £18.05 £15.50
25th Percentile £19.00 £29.37 £18.00
Median hourly rate £22.50 £66.25 £51.42
Median % change year-on-year -66.04% +28.84% +112.66%
75th Percentile £33.05 £70.00 £63.75
90th Percentile £34.83 £73.50 £77.70
South East median hourly rate £20.00 £57.25 £45.21
% change year-on-year -65.07% +26.63% +97.94%

Oracle
Job Vacancy Trend in Hampshire

Historical trend showing the proportion of contract IT job postings citing Oracle relative to all contract IT jobs advertised in Hampshire.
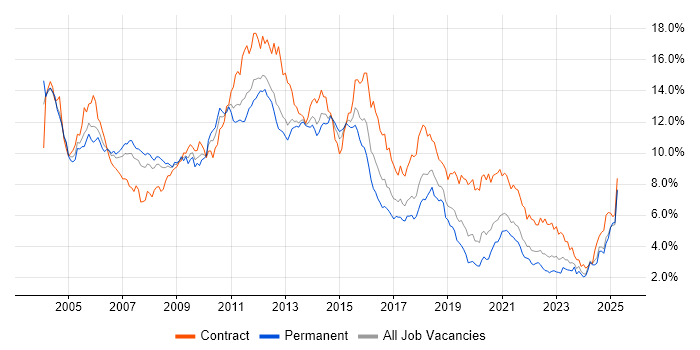
Oracle job vacancy trend in Hampshire

Oracle
Daily Rate Trend in Hampshire

Contractor daily rate distribution trend for jobs in Hampshire citing Oracle.

Contractor daily rate distribution trend for jobs in Hampshire citing Oracle

Oracle
Daily Rate Histogram in Hampshire

Daily rate distribution for jobs citing Oracle in Hampshire over the 6 months to 1 November 2025.

Daily rate histogram for Oracle in Hampshire

Oracle
Hourly Rate Trend in Hampshire

Contractor hourly rate distribution trend for jobs in Hampshire citing Oracle.

Contractor hourly rate distribution trend for jobs in Hampshire citing Oracle

Oracle
Contract Job Locations in Hampshire

The table below looks at the demand and provides a guide to the median contractor rates quoted in IT jobs citing Oracle within the Hampshire region over the 6 months to 1 November 2025. The 'Rank Change' column provides an indication of the change in demand within each location based on the same 6 month period last year.

Location Rank Change
on Same Period
Last Year
Matching
Contract
IT Job Ads
Median
Daily Rate
Past 6 Months
Median Daily Rate
% Change
on Same Period
Last Year
Live
Jobs
Havant +9 50 £625 +13.64%
Portsmouth +8 12 £515 +22.62% 1
Farnborough +10 8 £400 -27.27% 1
Southampton -10 2 £353 -21.67% 3
Fleet - 2 £486 - 2
Basingstoke -8 1 £675 - 3
Gosport - 1 - - 1
Oracle
South East

Oracle
Co-Occurring Skills & Capabilities in Hampshire by Category

The following tables expand on the one above by listing co-occurrences grouped by category. They cover the same employment type, locality and period, with up to 20 co-occurrences shown in each category:

Application Platforms
1 3 (3.80%) Confluence
1 3 (3.80%) Oracle SOA Suite
1 3 (3.80%) Oracle Workflow
1 3 (3.80%) SharePoint
2 2 (2.53%) WebLogic
Applications
1 2 (2.53%) Microsoft Excel
2 1 (1.27%) MS Visio
Business Applications
1 21 (26.58%) Oracle EBS
2 9 (11.39%) Oracle EBS R12
3 4 (5.06%) Oracle ERP
3 4 (5.06%) Oracle Procure-to-Pay
4 2 (2.53%) Oracle Payables
4 2 (2.53%) Primavera
5 1 (1.27%) Oracle AGIS
5 1 (1.27%) Oracle Applications
5 1 (1.27%) Oracle Assets
5 1 (1.27%) Oracle Cash Management
5 1 (1.27%) Oracle E-Business Tax
5 1 (1.27%) Oracle General Ledger
5 1 (1.27%) Oracle iProcurement
5 1 (1.27%) Oracle Receivables
5 1 (1.27%) Workday HCM
Cloud Services
1 25 (31.65%) OCI
2 15 (18.99%) Azure
3 10 (12.66%) Azure DevOps
4 9 (11.39%) Power Platform
5 5 (6.33%) SaaS
6 4 (5.06%) AWS
7 3 (3.80%) Microsoft 365
7 3 (3.80%) Miro
7 3 (3.80%) SuccessFactors
8 2 (2.53%) PaaS
9 1 (1.27%) Amazon S3
9 1 (1.27%) Datadog
9 1 (1.27%) GCP
9 1 (1.27%) OpenShift
9 1 (1.27%) Snowflake
Database & Business Intelligence
1 11 (13.92%) Oracle BI EE
2 9 (11.39%) Oracle BI Publisher
2 9 (11.39%) Power BI
3 7 (8.86%) Oracle Reports
4 6 (7.59%) Oracle Database
5 2 (2.53%) MongoDB
5 2 (2.53%) PostgreSQL
6 1 (1.27%) Amazon RDS
6 1 (1.27%) Apache Cassandra
6 1 (1.27%) Azure SQL Database
6 1 (1.27%) BusinessObjects
6 1 (1.27%) Data Hub
6 1 (1.27%) Data Warehouse
6 1 (1.27%) MySQL
6 1 (1.27%) NoSQL
6 1 (1.27%) RDBMS
6 1 (1.27%) Relational Database
6 1 (1.27%) SQL Server
Development Applications
1 6 (7.59%) JIRA
2 4 (5.06%) Jenkins
3 3 (3.80%) Cucumber
4 2 (2.53%) Bitbucket
4 2 (2.53%) REST Assured
4 2 (2.53%) Selenium
5 1 (1.27%) Oracle APEX
5 1 (1.27%) Oracle Forms
5 1 (1.27%) Visual Studio
General
1 33 (41.77%) Social Skills
2 15 (18.99%) Finance
3 10 (12.66%) Analytical Skills
4 3 (3.80%) Automotive
5 2 (2.53%) Electronics
5 2 (2.53%) Legal
5 2 (2.53%) Manufacturing
5 2 (2.53%) Public Sector
6 1 (1.27%) Banking
6 1 (1.27%) Documentation Skills
6 1 (1.27%) Games
Job Titles
1 20 (25.32%) Lead
2 11 (13.92%) Developer
3 7 (8.86%) Oracle Developer
3 7 (8.86%) Test Leader
4 6 (7.59%) Administrator
4 6 (7.59%) Analyst
4 6 (7.59%) Consultant
4 6 (7.59%) IFS Systems Administrator
4 6 (7.59%) Systems Administrator
5 5 (6.33%) Oracle Analyst
5 5 (6.33%) Programme Director
6 4 (5.06%) Data Migration Lead
6 4 (5.06%) Project Manager
6 4 (5.06%) Report Developer
6 4 (5.06%) Senior
6 4 (5.06%) Senior Data Warehouse Specialist
6 4 (5.06%) Technical Specialist
7 3 (3.80%) Test Analyst
7 3 (3.80%) UAT Lead
7 3 (3.80%) UAT Test Lead
Libraries, Frameworks & Software Standards
1 17 (21.52%) Oracle Fusion
2 2 (2.53%) .NET
2 2 (2.53%) REST
2 2 (2.53%) RESTful
2 2 (2.53%) SOAP
3 1 (1.27%) AngularJS
3 1 (1.27%) Elastic Stack
3 1 (1.27%) Middleware
3 1 (1.27%) Node.js
3 1 (1.27%) Oracle GoldenGate
3 1 (1.27%) React
3 1 (1.27%) Spring
3 1 (1.27%) Spring Batch
3 1 (1.27%) Spring Boot
3 1 (1.27%) Swagger
3 1 (1.27%) Web Services
Miscellaneous
1 13 (16.46%) Data Structures
2 2 (2.53%) CMDB
2 2 (2.53%) FMCG
3 1 (1.27%) Client/Server
3 1 (1.27%) Clustering
3 1 (1.27%) Management Information System
3 1 (1.27%) Replication
3 1 (1.27%) Team-Oriented Environment
Operating Systems
1 4 (5.06%) Unix
2 3 (3.80%) Windows
Processes & Methodologies
1 29 (36.71%) ERP
2 21 (26.58%) Stakeholder Engagement
3 16 (20.25%) Business Intelligence
3 16 (20.25%) Migration
4 13 (16.46%) Data Migration
5 12 (15.19%) Data Modelling
5 12 (15.19%) DevOps
6 11 (13.92%) Agile
6 11 (13.92%) Collaborative Working
6 11 (13.92%) Stakeholder Management
7 9 (11.39%) ITIL
7 9 (11.39%) Problem-Solving
8 8 (10.13%) Business Transformation
9 6 (7.59%) Continuous Improvement
9 6 (7.59%) Data Analysis
9 6 (7.59%) Logistics
9 6 (7.59%) Root Cause Analysis
10 5 (6.33%) Integration Testing
10 5 (6.33%) Performance Management
10 5 (6.33%) WFM
Programming Languages
1 21 (26.58%) SQL
2 10 (12.66%) PL/SQL
3 3 (3.80%) C#
3 3 (3.80%) Python
3 3 (3.80%) Shell Script
4 2 (2.53%) Delphi
4 2 (2.53%) Perl
5 1 (1.27%) Bash
5 1 (1.27%) Java
5 1 (1.27%) JavaScript
5 1 (1.27%) PowerShell
Qualifications
1 3 (3.80%) Azure Certification
2 2 (2.53%) AWS Certification
2 2 (2.53%) Security Cleared
2 2 (2.53%) Six Sigma Black Belt
2 2 (2.53%) Six Sigma Master Black Belt
3 1 (1.27%) AWS Certified Solutions Architect
3 1 (1.27%) Computer Science Degree
3 1 (1.27%) Degree
3 1 (1.27%) Microsoft Certification
3 1 (1.27%) OCP
3 1 (1.27%) Oracle Certification
3 1 (1.27%) SC Cleared
Quality Assurance & Compliance
1 11 (13.92%) GDPR
2 4 (5.06%) ISO/IEC 27001
3 3 (3.80%) COBIT
3 3 (3.80%) NIST
4 2 (2.53%) ISO/IEC 19770
4 2 (2.53%) QA
5 1 (1.27%) HIPAA
5 1 (1.27%) Sarbanes-Oxley
System Software
1 2 (2.53%) Oracle RAC
2 1 (1.27%) Docker
Systems Management
1 5 (6.33%) Oracle Enterprise Manager
2 3 (3.80%) HP ALM
3 2 (2.53%) Enterprise Manager Cloud Control
3 2 (2.53%) Kubernetes
3 2 (2.53%) Oracle RMAN
4 1 (1.27%) Ansible
4 1 (1.27%) CEMLI
Vendors
1 6 (7.59%) IFS
1 6 (7.59%) Microsoft
1 6 (7.59%) Salesforce
1 6 (7.59%) SAP
2 3 (3.80%) HP
3 2 (2.53%) IBM
3 2 (2.53%) ServiceNow
3 2 (2.53%) Snow
3 2 (2.53%) Teradata
3 2 (2.53%) Workday
4 1 (1.27%) CyberArk