C
East of England > Hertfordshire
The table below provides summary statistics for contract job vacancies advertised in Hertfordshire requiring C skills. It includes a benchmarking guide to the contractor rates offered in vacancies that cited C over the 6 months leading up to 1 May 2025, comparing them to the same period in the previous two years.
| 6 months to 1 May 2025 |
Same period 2024 | Same period 2023 | |
|---|---|---|---|
| Rank | 21 | 8 | 27 |
| Rank change year-on-year | -13 | +19 | +7 |
| Contract jobs citing C | 24 | 94 | 53 |
| As % of all contract jobs advertised in Hertfordshire | 7.48% | 11.27% | 6.54% |
| As % of the Programming Languages category | 23.53% | 50.00% | 21.54% |
| Number of daily rates quoted | 0 | 0 | 2 |
| 10th Percentile | - | - | £320 |
| 25th Percentile | - | - | £350 |
| Median daily rate (50th Percentile) | - | - | £400 |
| Median % change year-on-year | - | - | -36.00% |
| 75th Percentile | - | - | £450 |
| 90th Percentile | - | - | £480 |
| East of England median daily rate | £400 | £550 | £500 |
| % change year-on-year | -27.27% | +10.00% | - |
| Number of hourly rates quoted | 23 | 85 | 31 |
| 10th Percentile | £55.00 | £61.25 | £57.00 |
| 25th Percentile | £59.00 | £62.50 | - |
| Median hourly rate | £80.00 | £65.00 | £65.00 |
| Median % change year-on-year | +23.08% | - | +8.33% |
| 75th Percentile | £85.00 | £85.00 | £77.00 |
| 90th Percentile | £89.50 | £90.00 | £90.00 |
| East of England median hourly rate | £80.00 | £65.00 | £65.00 |
| % change year-on-year | +23.08% | - | +13.04% |
All Programming Languages
Hertfordshire
C falls under the Programming Languages category. For comparison with the information above, the following table provides summary statistics for all contract job vacancies requiring coding skills in Hertfordshire.
| Contract vacancies with a requirement for coding skills | 102 | 188 | 246 |
| As % of all contract IT jobs advertised in Hertfordshire | 31.78% | 22.54% | 30.33% |
| Number of daily rates quoted | 51 | 49 | 101 |
| 10th Percentile | £399 | £360 | £363 |
| 25th Percentile | £463 | £400 | £400 |
| Median daily rate (50th Percentile) | £550 | £430 | £500 |
| Median % change year-on-year | +27.91% | -14.00% | +5.26% |
| 75th Percentile | £634 | £506 | £600 |
| 90th Percentile | £675 | £650 | £676 |
| East of England median daily rate | £479 | £475 | £488 |
| % change year-on-year | +0.79% | -2.56% | +2.63% |
| Number of hourly rates quoted | 40 | 108 | 84 |
| 10th Percentile | £49.77 | £60.00 | £53.75 |
| 25th Percentile | £60.69 | £61.25 | £54.69 |
| Median hourly rate | £70.00 | £65.00 | £65.00 |
| Median % change year-on-year | +7.69% | - | +16.07% |
| 75th Percentile | £85.00 | £70.00 | £70.00 |
| 90th Percentile | £87.50 | £90.00 | £77.00 |
| East of England median hourly rate | £66.00 | £65.00 | £65.00 |
| % change year-on-year | +1.54% | - | +16.07% |
C
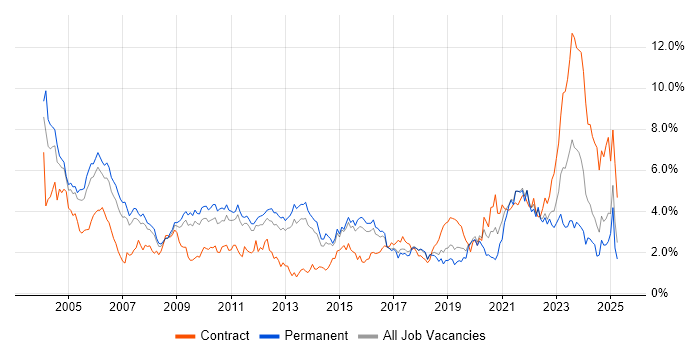
Job Vacancy Trend in Hertfordshire
Job postings citing C as a proportion of all IT jobs advertised in Hertfordshire.

C
Contractor Daily Rate Trend in Hertfordshire
3-month moving average daily rate quoted in jobs citing C in Hertfordshire.
C
Contractor Hourly Rate Trend in Hertfordshire
3-month moving average hourly rates quoted in jobs citing C in Hertfordshire.
C
Hourly Rate Histogram in Hertfordshire
Hourly rate distribution of jobs citing C in Hertfordshire over the 6 months to 1 May 2025.
C
Contract Job Locations in Hertfordshire
The table below looks at the demand and provides a guide to the median contractor rates quoted in IT jobs citing C within the Hertfordshire region over the 6 months to 1 May 2025. The 'Rank Change' column provides an indication of the change in demand within each location based on the same 6 month period last year.
| Location | Rank Change on Same Period Last Year |
Matching Contract IT Job Ads |
Median Daily Rate Past 6 Months |
Median Daily Rate % Change on Same Period Last Year |
Live Jobs |
|---|---|---|---|---|---|
| Stevenage | -2 | 21 | - | - | 34 |
| C East of England |
|||||
C
Co-occurring Skills and Capabilities in Hertfordshire by Category
The follow tables expand on the table above by listing co-occurrences grouped by category. The same employment type, locality and period is covered with up to 20 co-occurrences shown in each of the following categories:
|
|
|||||||||||||||||||||||||||||||||||||||||||||||||||||||||||||||||||||
|
|
|||||||||||||||||||||||||||||||||||||||||||||||||||||||||||||||||||||
|
|
|||||||||||||||||||||||||||||||||||||||||||||||||||||||||||||||||||||
|
|
|||||||||||||||||||||||||||||||||||||||||||||||||||||||||||||||||||||
|
|
|||||||||||||||||||||||||||||||||||||||||||||||||||||||||||||||||||||
|
||||||||||||||||||||||||||||||||||||||||||||||||||||||||||||||||||||||
