Google Firebase
Merseyside > Liverpool
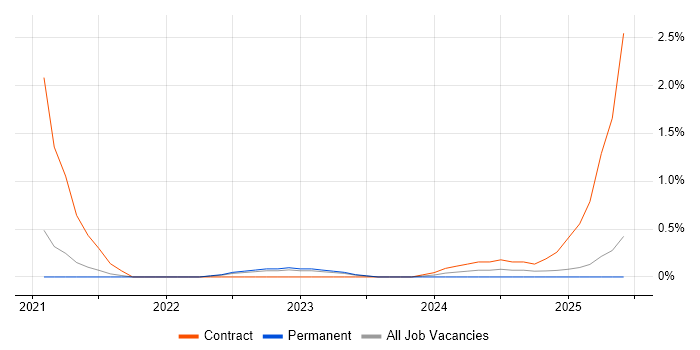
The table below provides summary statistics for contract job vacancies advertised in Liverpool requiring Firebase skills. It includes a benchmarking guide to the contractor rates offered in vacancies that cited Firebase over the 6 months leading up to 8 July 2025, comparing them to the same period in the previous two years.
|
|
6 months to
8 Jul 2025 |
Same period 2024 |
Same period 2023 |
| Rank |
25 |
- |
- |
| Rank change year-on-year |
- |
- |
- |
| Contract jobs citing Firebase |
1 |
0 |
0 |
| As % of all contract jobs advertised in Liverpool |
0.75% |
- |
- |
| As % of the Cloud Services category |
2.50% |
- |
- |
| Number of daily rates quoted |
0 |
0 |
0 |
| Median daily rate (50th Percentile) |
- |
- |
- |
| Merseyside median daily rate |
- |
- |
- |
Firebase falls under the Cloud Services category. For comparison with the information above, the following table provides summary statistics for all contract job vacancies requiring cloud computing skills in Liverpool.
| Contract vacancies with a requirement for cloud computing skills |
40 |
54 |
73 |
| As % of all contract IT jobs advertised in Liverpool |
29.85% |
31.21% |
30.17% |
| Number of daily rates quoted |
36 |
31 |
54 |
| 10th Percentile |
£145 |
£143 |
£240 |
| 25th Percentile |
£369 |
£161 |
£370 |
| Median daily rate (50th Percentile) |
£425 |
£260 |
£444 |
| Median % change year-on-year |
+63.46% |
-41.41% |
+4.41% |
| 75th Percentile |
£475 |
£394 |
£497 |
| 90th Percentile |
£594 |
£463 |
£538 |
| Merseyside median daily rate |
£425 |
£255 |
£475 |
| % change year-on-year |
+66.67% |
-46.32% |
+11.76% |
| Number of hourly rates quoted |
0 |
10 |
6 |
| 10th Percentile |
- |
- |
£16.22 |
| 25th Percentile |
- |
£15.50 |
£16.25 |
| Median hourly rate |
- |
£16.00 |
£17.50 |
| Median % change year-on-year |
- |
-8.57% |
- |
| 75th Percentile |
- |
£17.63 |
£25.16 |
| 90th Percentile |
- |
£20.48 |
£45.15 |
| Merseyside median hourly rate |
- |
£16.00 |
£17.50 |
| % change year-on-year |
- |
-8.57% |
- |

