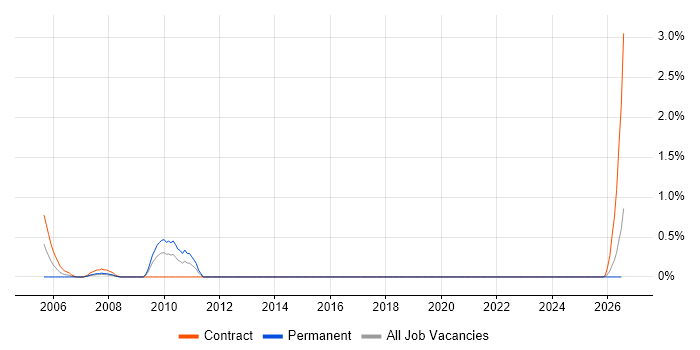
Web Infrastructure Engineer
Merseyside > Liverpool
As of 22 August 2026, there is not enough information available from job vacancies posted within the last 6 months to determine the median Web Infrastructure Engineer daily rate in Liverpool.
|
|
6 months to
22 Aug 2026 |
Same period 2025 |
Same period 2024 |
| Rank |
40 |
- |
- |
| Rank change year-on-year |
- |
- |
- |
| Contract jobs requiring a Web Infrastructure Engineer |
3 |
0 |
0 |
| As % of all contract jobs in Liverpool |
0.99% |
- |
- |
| As % of the Job Titles category |
1.07% |
- |
- |
| Number of daily rates quoted |
0 |
0 |
0 |
| Median daily rate (50th Percentile) |
- |
- |
- |
| Merseyside median daily rate |
- |
- |
- |
For comparison with the information above, the following table provides summary statistics for all contract IT job vacancies in Liverpool. Most job vacancies include a discernible job title that can be normalized. As such, the figures in the second row provide an indication of the number of contract jobs in our overall sample.
| Contract vacancies in Liverpool with a recognized job title |
280 |
147 |
153 |
| % of contract IT jobs with a recognized job title |
92.11% |
96.71% |
95.03% |
| Number of daily rates quoted |
154 |
92 |
74 |
| 10th Percentile |
£146 |
£162 |
£158 |
| 25th Percentile |
£194 |
£350 |
£213 |
| Median daily rate (50th Percentile) |
£438 |
£475 |
£425 |
| Median % change year-on-year |
-7.79% |
+11.76% |
-13.04% |
| 75th Percentile |
£575 |
£625 |
£538 |
| 90th Percentile |
£638 |
£688 |
£600 |
| Merseyside median daily rate |
£438 |
£438 |
£406 |
| % change year-on-year |
+0.11% |
+7.69% |
-17.09% |
| Number of hourly rates quoted |
9 |
11 |
15 |
| 10th Percentile |
£18.39 |
- |
£16.88 |
| 25th Percentile |
£20.87 |
£12.21 |
£18.03 |
| Median hourly rate |
£24.72 |
£17.30 |
£21.59 |
| Median % change year-on-year |
+42.89% |
-19.87% |
+13.63% |
| 75th Percentile |
£25.38 |
£17.44 |
£24.18 |
| 90th Percentile |
£29.55 |
- |
£36.15 |
| Merseyside median hourly rate |
£25.38 |
£17.44 |
£21.80 |
| % change year-on-year |
+45.53% |
-19.98% |
+14.71% |