Confluence Contract Job Trends in Northampton

Confluence
Northamptonshire > Northampton

The table below provides summary statistics and contractor rates for jobs advertised in Northampton requiring Confluence skills. It covers contract job vacancies from the 6 months leading up to 1 October 2025, with comparisons to the same periods in the previous two years.

6 months to
1 Oct 2025
Same period 2024 Same period 2023
Rank 32 30 -
Rank change year-on-year -2 - -
Contract jobs citing Confluence 16 5 0
As % of all contract jobs in Northampton 5.67% 2.35% -
As % of the Application Platforms category 48.48% 23.81% -
Number of daily rates quoted 15 4 0
10th Percentile £269 £355 -
25th Percentile £287 £356 -
Median daily rate (50th Percentile) £330 £365 -
Median % change year-on-year -9.67% - -
75th Percentile £351 £379 -
90th Percentile £448 £386 -
Northamptonshire median daily rate £330 £365 -
% change year-on-year -9.67% - -

All Application Platform Skills
Northampton

Confluence falls under the Application Platforms category. For comparison with the information above, the following table provides summary statistics for all contract job vacancies requiring application platform skills in Northampton.

Contract vacancies with a requirement for application platform skills 33 21 26
As % of all contract IT jobs advertised in Northampton 11.70% 9.86% 21.85%
Number of daily rates quoted 31 16 18
10th Percentile £270 £356 £163
25th Percentile £312 £375 £189
Median daily rate (50th Percentile) £340 £419 £225
Median % change year-on-year -18.81% +86.11% -40.98%
75th Percentile £418 £451 £400
90th Percentile £445 £488 £491
Northamptonshire median daily rate £345 £413 £275
% change year-on-year -16.36% +50.00% -27.87%

Confluence
Job Vacancy Trend in Northampton

Job postings citing Confluence as a proportion of all IT jobs advertised in Northampton.
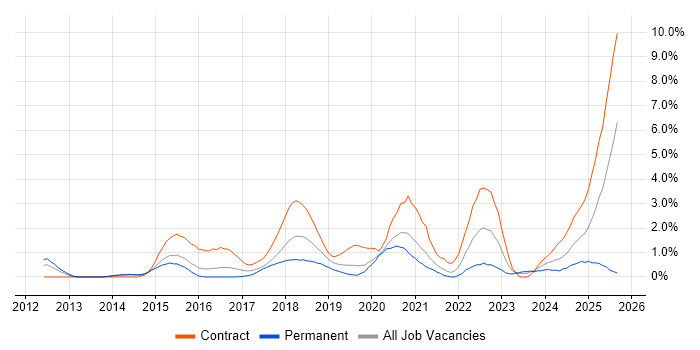
Job vacancy trend for Confluence in Northampton

Confluence
Daily Rate Trend in Northampton

Contractor daily rate distribution trend for jobs in Northampton citing Confluence.

Contractor daily rate distribution trend for jobs in Northampton citing Confluence

Confluence
Daily Rate Histogram in Northampton

Daily rate distribution for jobs citing Confluence in Northampton over the 6 months to 1 October 2025.

Daily rate histogram for Confluence in Northampton

Confluence
Co-occurring Skills and Capabilities in Northampton by Category

The follow tables expand on the table above by listing co-occurrences grouped by category. The same employment type, locality and period is covered with up to 20 co-occurrences shown in each of the following categories:

Applications
1 3 (18.75%) Microsoft Office
2 2 (12.50%) Microsoft Project
2 2 (12.50%) MS Visio
3 1 (6.25%) Microsoft Excel
3 1 (6.25%) Microsoft PowerPoint
Business Applications
1 2 (12.50%) Loan IQ
Database & Business Intelligence
1 4 (25.00%) SQL Server
2 1 (6.25%) Tableau
Development Applications
1 16 (100.00%) JIRA
2 6 (37.50%) Cucumber
2 6 (37.50%) Selenium
3 4 (25.00%) Bitbucket
3 4 (25.00%) GitLab
3 4 (25.00%) JUnit
3 4 (25.00%) Maven
3 4 (25.00%) Mockito
3 4 (25.00%) SonarQube
3 4 (25.00%) Sonatype Nexus
4 2 (12.50%) Jenkins
4 2 (12.50%) Postman
5 1 (6.25%) JMeter
General
1 7 (43.75%) Finance
2 5 (31.25%) Banking
3 4 (25.00%) Analytical Skills
4 3 (18.75%) Social Skills
5 2 (12.50%) Legal
6 1 (6.25%) Public Sector
Job Titles
1 6 (37.50%) Business Analyst
2 5 (31.25%) Analyst
3 3 (18.75%) Developer
3 3 (18.75%) Java Developer
4 2 (12.50%) Delivery Manager
4 2 (12.50%) Full-Stack Developer
4 2 (12.50%) Full-Stack Java Developer
4 2 (12.50%) Lead
4 2 (12.50%) Salesforce Analyst
4 2 (12.50%) Salesforce Business Analyst
5 1 (6.25%) DevOps Developer
5 1 (6.25%) Front-End Developer (Client-Side Developer)
5 1 (6.25%) Front-End Java Developer (Client-Side Java Developer)
5 1 (6.25%) Front-End Web Developer (Client-Side Web Developer)
5 1 (6.25%) Java Web Developer
5 1 (6.25%) JavaScript Developer
5 1 (6.25%) SQL Developer
5 1 (6.25%) Technical Business Analyst
5 1 (6.25%) Test Automation Engineer
5 1 (6.25%) Test Engineer
Libraries, Frameworks & Software Standards
1 4 (25.00%) CSS
1 4 (25.00%) Hibernate
1 4 (25.00%) HTML
1 4 (25.00%) Jest
1 4 (25.00%) JPA
1 4 (25.00%) Node.js
1 4 (25.00%) React
1 4 (25.00%) Redux
1 4 (25.00%) Spring Boot
2 2 (12.50%) Playwright
3 1 (6.25%) .NET
3 1 (6.25%) .NET Framework
3 1 (6.25%) RAML
3 1 (6.25%) REST
3 1 (6.25%) SOAP
3 1 (6.25%) Spring
3 1 (6.25%) Web Services
Miscellaneous
1 4 (25.00%) Onboarding
2 2 (12.50%) Product Ownership
3 1 (6.25%) Analytical Mindset
Processes & Methodologies
1 9 (56.25%) Agile
2 7 (43.75%) Stakeholder Management
3 6 (37.50%) CI/CD
3 6 (37.50%) Microservices
3 6 (37.50%) Test Automation
4 5 (31.25%) Continuous Improvement
4 5 (31.25%) DevOps
5 4 (25.00%) Anti-Money Laundering
5 4 (25.00%) KYC
5 4 (25.00%) TDD
6 3 (18.75%) Acceptance Criteria
6 3 (18.75%) Full-Stack Development
6 3 (18.75%) Project Management
6 3 (18.75%) Stakeholder Engagement
6 3 (18.75%) Workshop Facilitation
7 2 (12.50%) Client Onboarding
7 2 (12.50%) Regulatory Compliance
7 2 (12.50%) Sprint Planning
7 2 (12.50%) Sprint Retrospective
7 2 (12.50%) Sprint Review
Programming Languages
1 6 (37.50%) Java
2 5 (31.25%) SQL
3 4 (25.00%) JavaScript
Qualifications
1 1 (6.25%) BPSS Clearance
1 1 (6.25%) Degree
1 1 (6.25%) Security Cleared
Quality Assurance & Compliance
1 2 (12.50%) GDPR
Vendors
1 4 (25.00%) Microsoft
1 4 (25.00%) Veracode
2 2 (12.50%) DocuSign
2 2 (12.50%) Salesforce