
Embedded C
England > South East
The table below provides summary statistics and contractor rates for jobs advertised in the South East requiring Embedded C skills. It covers contract job vacancies from the 6 months leading up to 2 August 2026, with comparisons to the same periods in the previous two years.
|
|
6 months to 2 Aug 2026 |
Same period 2025 | Same period 2024 |
|---|---|---|---|
| Rank | 218 | 162 | 180 |
| Rank change year-on-year | -56 | +18 | +18 |
| Contract jobs citing Embedded C | 15 | 2 | 7 |
| As % of all contract jobs in the South East | 0.22% | 0.057% | 0.14% |
| As % of the Programming Languages category | 1.11% | 0.22% | 0.58% |
| Number of daily rates quoted | 2 | 1 | 4 |
| 10th Percentile | - | - | £490 |
| 25th Percentile | £513 | £513 | £513 |
| Median daily rate (50th Percentile) | £525 | £525 | £643 |
| Median % change year-on-year | - | -18.29% | +42.78% |
| 75th Percentile | £538 | £538 | £782 |
| 90th Percentile | - | - | £794 |
| England median daily rate | £525 | £513 | £525 |
| % change year-on-year | +2.44% | -2.38% | +12.00% |
| Number of hourly rates quoted | 0 | 0 | 1 |
| 10th Percentile | - | - | - |
| 25th Percentile | - | - | £50.75 |
| Median hourly rate | - | - | £51.50 |
| 75th Percentile | - | - | £52.25 |
| 90th Percentile | - | - | - |
| England median hourly rate | £68.75 | £90.00 | £70.00 |
| % change year-on-year | -23.61% | +28.57% | -9.09% |
All Programming Languages
South East
Embedded C falls under the Programming Languages category. For comparison with the information above, the following table provides summary statistics for all contract job vacancies requiring coding skills in the South East.
| Contract vacancies with a requirement for coding skills | 1,347 | 894 | 1,210 |
| As % of all contract IT jobs advertised in the South East | 20.18% | 25.56% | 24.27% |
| Number of daily rates quoted | 847 | 620 | 828 |
| 10th Percentile | £310 | £318 | £325 |
| 25th Percentile | £405 | £409 | £413 |
| Median daily rate (50th Percentile) | £513 | £500 | £513 |
| Median % change year-on-year | +2.50% | -2.44% | -2.38% |
| 75th Percentile | £600 | £588 | £608 |
| 90th Percentile | £688 | £638 | £651 |
| England median daily rate | £523 | £515 | £550 |
| % change year-on-year | +1.46% | -6.36% | - |
| Number of hourly rates quoted | 93 | 23 | 63 |
| 10th Percentile | £29.14 | £33.10 | £27.00 |
| 25th Percentile | £38.25 | £47.62 | £54.18 |
| Median hourly rate | £60.00 | £52.50 | £65.00 |
| Median % change year-on-year | +14.29% | -19.23% | +18.18% |
| 75th Percentile | £70.00 | £58.72 | £75.00 |
| 90th Percentile | £82.25 | £64.36 | £77.50 |
| England median hourly rate | £65.00 | £57.50 | £65.00 |
| % change year-on-year | +13.04% | -11.54% | +4.00% |
Embedded C
Job Vacancy Trend in the South East
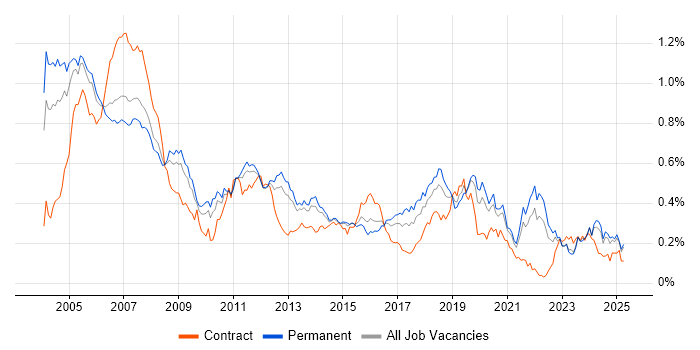
Historical trend showing the proportion of contract IT job postings citing Embedded C relative to all contract IT jobs advertised in the South East.
Embedded C
Daily Rate Trend in the South East
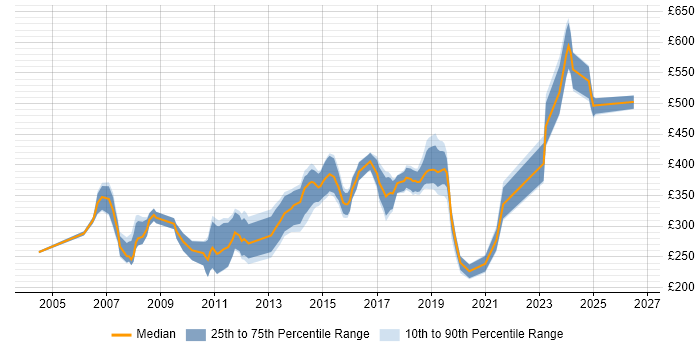
Contractor daily rate distribution trend for jobs in the South East citing Embedded C.
Embedded C
Hourly Rate Trend in the South East
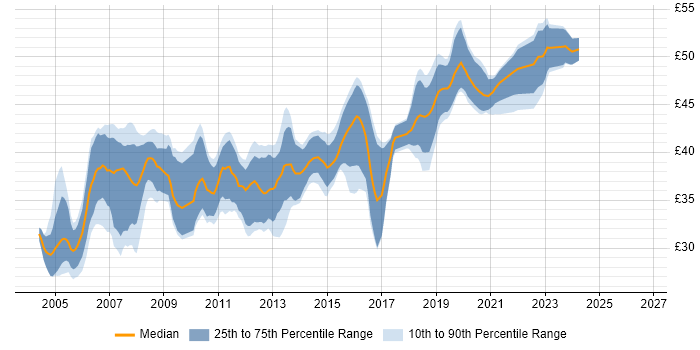
Contractor hourly rate distribution trend for jobs in the South East citing Embedded C.
Embedded C
Contract Job Locations in the South East
The table below looks at the demand and provides a guide to the median contractor rates quoted in IT jobs citing Embedded C within the South East region over the 6 months to 2 August 2026. The 'Rank Change' column provides an indication of the change in demand within each location based on the same 6 month period last year.
| Location | Rank Change on Same Period Last Year |
Matching Contract IT Job Ads |
Median Daily Rate Past 6 Months |
Median Daily Rate % Change on Same Period Last Year |
Live Jobs |
|---|---|---|---|---|---|
| Surrey | - | 7 | - | - | 1 |
| Oxfordshire | -17 | 5 | £525 | - | 6 |
| Thames Valley | -41 | 5 | £525 | - | 7 |
| Hampshire | -34 | 3 | - | - | 4 |
| Embedded C England |
|||||
Embedded C
Co-Occurring Skills & Capabilities in the South East by Category
The following tables expand on the one above by listing co-occurrences grouped by category. They cover the same employment type, locality and period, with up to 20 co-occurrences shown in each category: