TigerGraph
UK
The table below provides summary statistics for contract job vacancies requiring TigerGraph skills. It includes a benchmarking guide to the contractor rates offered in vacancies that cited TigerGraph over the 6 months leading up to 7 June 2025, comparing them to the same period in the previous two years.
| 6 months to 7 Jun 2025 |
Same period 2024 | Same period 2023 | |
|---|---|---|---|
| Rank | - | - | 677 |
| Rank change year-on-year | - | - | +178 |
| Contract jobs citing TigerGraph | 0 | 0 | 2 |
| As % of all contract jobs advertised in the UK | - | - | 0.004% |
| As % of the Database & Business Intelligence category | - | - | 0.020% |
| Number of daily rates quoted | 0 | 0 | 2 |
| 10th Percentile | - | - | £545 |
| 25th Percentile | - | - | £556 |
| Median daily rate (50th Percentile) | - | - | £600 |
| Median % change year-on-year | - | - | -17.24% |
| 75th Percentile | - | - | £631 |
| 90th Percentile | - | - | £635 |
| UK excluding London median daily rate | - | - | - |
All Database and Business Intelligence Skills
UK
TigerGraph falls under the Databases and Business Intelligence category. For comparison with the information above, the following table provides summary statistics for all contract job vacancies requiring database or business intelligence skills.
| Contract vacancies with a requirement for database or business intelligence skills | 5,509 | 7,376 | 9,906 |
| As % of all contract IT jobs advertised in the UK | 18.81% | 16.99% | 17.73% |
| Number of daily rates quoted | 3,747 | 5,288 | 7,035 |
| 10th Percentile | £358 | £350 | £375 |
| 25th Percentile | £415 | £425 | £450 |
| Median daily rate (50th Percentile) | £515 | £525 | £548 |
| Median % change year-on-year | -1.90% | -4.11% | -0.45% |
| 75th Percentile | £638 | £650 | £663 |
| 90th Percentile | £761 | £775 | £757 |
| UK excluding London median daily rate | £475 | £475 | £500 |
| % change year-on-year | - | -5.00% | - |
| Number of hourly rates quoted | 102 | 152 | 176 |
| 10th Percentile | £19.72 | £14.00 | £21.24 |
| 25th Percentile | £23.50 | £20.77 | £35.00 |
| Median hourly rate | £34.19 | £40.00 | £60.00 |
| Median % change year-on-year | -14.53% | -33.33% | +38.20% |
| 75th Percentile | £65.34 | £55.63 | £74.06 |
| 90th Percentile | £77.38 | £72.50 | £81.25 |
| UK excluding London median hourly rate | £31.64 | £35.00 | £58.59 |
| % change year-on-year | -9.60% | -40.26% | +67.40% |
TigerGraph
Job Vacancy Trend
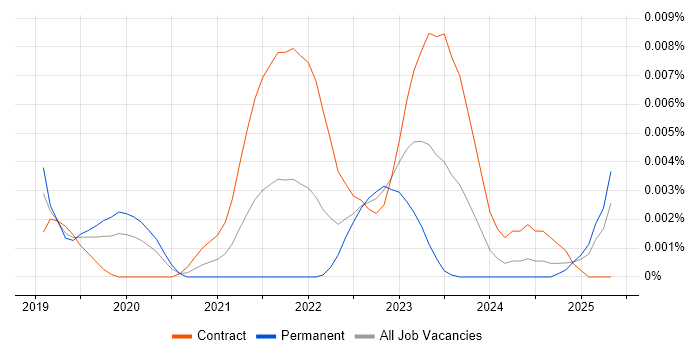
Job postings citing TigerGraph as a proportion of all IT jobs advertised.

TigerGraph
Contractor Daily Rate Trend
3-month moving average daily rate quoted in jobs citing TigerGraph.
