Service Level Agreement (SLA)
Warwickshire > Warwick
The table below provides summary statistics and contractor rates for jobs advertised in Warwick requiring SLA skills. It covers contract job vacancies from the 6 months leading up to 14 November 2025, with comparisons to the same periods in the previous two years.
| 6 months to 14 Nov 2025 |
Same period 2024 | Same period 2023 | |
|---|---|---|---|
| Rank | 30 | 28 | 24 |
| Rank change year-on-year | -2 | -4 | +1 |
| Contract jobs citing SLA | 8 | 9 | 1 |
| As % of all contract jobs in Warwick | 2.77% | 4.17% | 0.79% |
| As % of the Quality Assurance & Compliance category | 12.70% | 25.00% | 3.57% |
| Number of daily rates quoted | 6 | 8 | 0 |
| 10th Percentile | £393 | £352 | - |
| 25th Percentile | £400 | £398 | - |
| Median daily rate (50th Percentile) | £413 | £425 | - |
| Median % change year-on-year | -2.94% | - | - |
| 75th Percentile | £447 | £438 | - |
| 90th Percentile | £475 | £486 | - |
| Warwickshire median daily rate | £293 | £425 | - |
| % change year-on-year | -31.18% | - | - |
All Quality Assurance and Compliance Skills
Warwick
SLA falls under the Quality Assurance and Compliance category. For comparison with the information above, the following table provides summary statistics for all contract job vacancies requiring quality assurance or compliance skills in Warwick.
| Contract vacancies with a requirement for quality assurance or compliance skills | 63 | 36 | 28 |
| As % of all contract IT jobs advertised in Warwick | 21.80% | 16.67% | 22.22% |
| Number of daily rates quoted | 34 | 23 | 21 |
| 10th Percentile | £390 | - | £425 |
| 25th Percentile | £413 | £413 | £513 |
| Median daily rate (50th Percentile) | £500 | £500 | £550 |
| Median % change year-on-year | - | -9.09% | +4.76% |
| 75th Percentile | £616 | £538 | £688 |
| 90th Percentile | £760 | £598 | £750 |
| Warwickshire median daily rate | £475 | £500 | £550 |
| % change year-on-year | -5.00% | -9.09% | +10.00% |
SLA
Job Vacancy Trend in Warwick
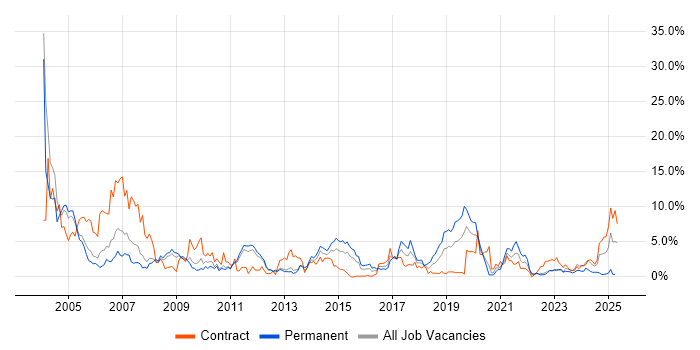
Historical trend showing the proportion of contract IT job postings citing SLA relative to all contract IT jobs advertised in Warwick.

SLA
Daily Rate Trend in Warwick
Contractor daily rate distribution trend for jobs in Warwick citing SLA.

SLA
Daily Rate Histogram in Warwick
Daily rate distribution for jobs citing SLA in Warwick over the 6 months to 14 November 2025.
SLA
Hourly Rate Trend in Warwick
Contractor hourly rate distribution trend for jobs in Warwick citing SLA.

SLA
Co-Occurring Skills & Capabilities in Warwick by Category
The following tables expand on the one above by listing co-occurrences grouped by category. They cover the same employment type, locality and period, with up to 20 co-occurrences shown in each category:
