AI Engineering
Berkshire > Windsor
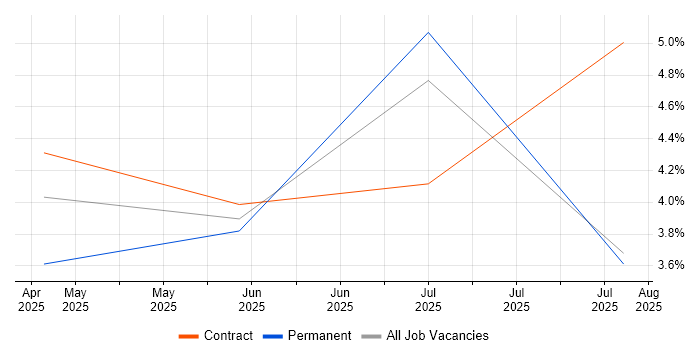
The table below provides summary statistics and contractor rates for jobs advertised in Windsor requiring Artificial Intelligence Engineering skills. It covers vacancies from the 6 months leading up to 11 September 2025, with comparisons to the same periods in the previous two years.
|
|
6 months to
11 Sep 2025 |
Same period 2024 |
Same period 2023 |
| Rank |
19 |
- |
- |
| Rank change year-on-year |
- |
- |
- |
| Contract jobs citing Artificial Intelligence Engineering |
2 |
0 |
0 |
| As % of all contract jobs advertised in Windsor |
2.94% |
- |
- |
| As % of the Processes & Methodologies category |
2.99% |
- |
- |
| Number of daily rates quoted |
1 |
0 |
0 |
| 10th Percentile |
- |
- |
- |
| 25th Percentile |
£725 |
- |
- |
| Median daily rate (50th Percentile) |
£750 |
- |
- |
| 75th Percentile |
£775 |
- |
- |
| 90th Percentile |
- |
- |
- |
| Berkshire median daily rate |
£738 |
- |
- |
Artificial Intelligence Engineering falls under the Processes and Methodologies category. For comparison with the information above, the following table provides summary statistics for all contract job vacancies requiring process or methodology skills in Windsor.
| Contract vacancies with a requirement for process or methodology skills |
67 |
40 |
15 |
| As % of all contract IT jobs advertised in Windsor |
98.53% |
90.91% |
100.00% |
| Number of daily rates quoted |
45 |
23 |
13 |
| 10th Percentile |
£450 |
£419 |
£393 |
| 25th Percentile |
£500 |
£500 |
£481 |
| Median daily rate (50th Percentile) |
£525 |
£600 |
£590 |
| Median % change year-on-year |
-12.50% |
+1.69% |
+38.82% |
| 75th Percentile |
£675 |
£681 |
£688 |
| 90th Percentile |
£775 |
£733 |
£728 |
| Berkshire median daily rate |
£512 |
£550 |
£525 |
| % change year-on-year |
-6.95% |
+4.76% |
+5.00% |

