Manufacturing
Cumbria > Kirkby-in-Furness
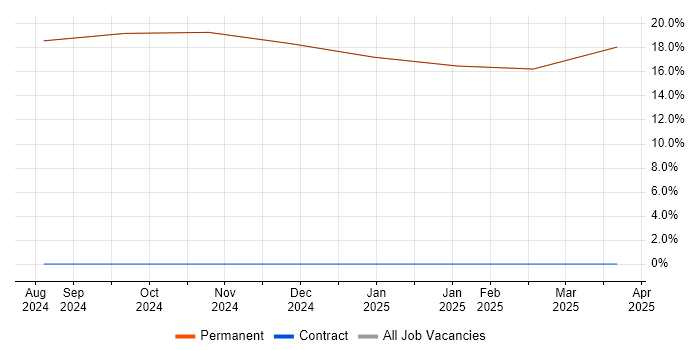
The table below looks at the prevalence of the term Manufacturing in permanent job vacancies in Kirkby-in-Furness. Included is a benchmarking guide to the salaries offered in vacancies that cited Manufacturing over the 6 months leading up to 14 October 2025, comparing them to the same period in the previous two years.
|
|
6 months to
14 Oct 2025 |
Same period 2024 |
Same period 2023 |
| Rank |
6 |
3 |
- |
| Rank change year-on-year |
-3 |
- |
- |
| Permanent jobs citing Manufacturing |
4 |
1 |
0 |
| As % of all permanent jobs in Kirkby-in-Furness |
23.53% |
25.00% |
- |
| As % of the General category |
66.67% |
100.00% |
- |
| Number of salaries quoted |
1 |
1 |
0 |
| 10th Percentile |
- |
- |
- |
| 25th Percentile |
£49,453 |
- |
- |
| Median annual salary (50th Percentile) |
£51,636 |
£50,000 |
- |
| Median % change year-on-year |
+3.27% |
- |
- |
| 75th Percentile |
£53,818 |
- |
- |
| 90th Percentile |
- |
- |
- |
| Cumbria median annual salary |
£57,500 |
£56,000 |
£35,000 |
| % change year-on-year |
+2.68% |
+60.00% |
-41.67% |
Manufacturing falls under the General Skills category. For comparison with the information above, the following table provides summary statistics for all permanent job vacancies requiring common skills in Kirkby-in-Furness.
| Permanent vacancies with a requirement for common skills |
6 |
1 |
0 |
| As % of all permanent jobs advertised in Kirkby-in-Furness |
35.29% |
25.00% |
- |
| Number of salaries quoted |
3 |
1 |
0 |
| 10th Percentile |
- |
- |
- |
| 25th Percentile |
- |
- |
- |
| Median annual salary (50th Percentile) |
£46,000 |
£50,000 |
- |
| Median % change year-on-year |
-8.00% |
- |
- |
| 75th Percentile |
£49,909 |
- |
- |
| 90th Percentile |
£52,254 |
- |
- |
| Cumbria median annual salary |
£40,000 |
£52,000 |
£33,500 |
| % change year-on-year |
-23.08% |
+55.22% |
-16.25% |

