Biotechnology Jobs in Oxford

Biotechnology (Biotech)
Oxfordshire > Oxford

The following table provides summary statistics for permanent job vacancies advertised in Oxford with a requirement for Biotechnology skills. Included is a benchmarking guide to the salaries offered in vacancies that have cited Biotechnology over the 6 months to 26 April 2024 with a comparison to the same period in the previous 2 years.

6 months to
26 Apr 2024
Same period 2023 Same period 2022
Rank 32 30 47
Rank change year-on-year -2 +17 +9
Permanent jobs citing Biotechnology 31 23 17
As % of all permanent jobs advertised in Oxford 4.75% 4.83% 3.36%
As % of the Processes & Methodologies category 5.43% 5.15% 3.51%
Number of salaries quoted 23 12 1
10th Percentile £43,350 - -
25th Percentile £53,750 £45,000 £46,250
Median annual salary (50th Percentile) £73,500 £55,000 £47,500
Median % change year-on-year +33.64% +15.79% -16.30%
75th Percentile £78,750 £60,000 £48,750
90th Percentile £83,750 £66,750 -
Oxfordshire median annual salary £73,500 £55,000 £61,250
% change year-on-year +33.64% -10.20% +2.08%

All Process and Methodology Skills
Oxford

Biotechnology is in the Processes and Methodologies category. The following table is for comparison with the above and provides summary statistics for all permanent job vacancies advertised in Oxford with a requirement for process or methodology skills.

Permanent vacancies with a requirement for process or methodology skills 571 447 484
As % of all permanent jobs advertised in Oxford 87.44% 93.91% 95.65%
Number of salaries quoted 425 275 287
10th Percentile £29,000 £30,500 £28,650
25th Percentile £38,750 £39,875 £40,625
Median annual salary (50th Percentile) £52,500 £55,000 £60,000
Median % change year-on-year -4.55% -8.33% +20.00%
75th Percentile £63,750 £71,875 £68,750
90th Percentile £75,000 £85,000 £80,000
Oxfordshire median annual salary £47,750 £50,000 £55,000
% change year-on-year -4.50% -9.09% +11.11%

Biotechnology
Job Vacancy Trend in Oxford

Job postings citing Biotechnology as a proportion of all IT jobs advertised in Oxford.
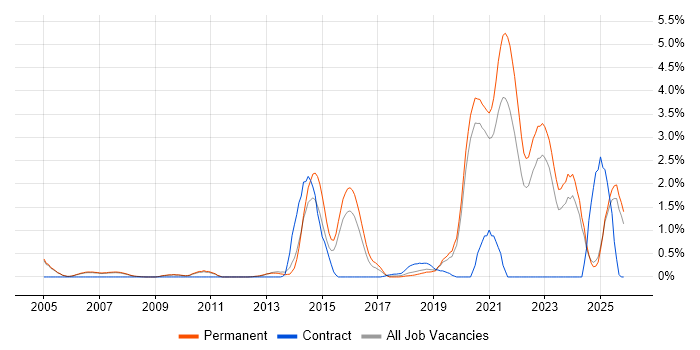
Job vacancy trend for Biotechnology in Oxford

Biotechnology
Salary Trend in Oxford

3-month moving average salary quoted in jobs citing Biotechnology in Oxford.

Salary trend for Biotechnology in Oxford

Biotechnology
Salary Histogram in Oxford

Salary distribution for jobs citing Biotechnology in Oxford over the 6 months to 26 April 2024.

Salary histogram for Biotechnology in Oxford

Biotechnology
Co-occurring Skills and Capabilities in Oxford by Category

The follow tables expand on the table above by listing co-occurrences grouped by category. The same employment type, locality and period is covered with up to 20 co-occurrences shown in each of the following categories:

Application Platforms
1 1 (3.23%) Confluence
1 1 (3.23%) WordPress
Database & Business Intelligence
1 1 (3.23%) MySQL
Development Applications
1 1 (3.23%) Git
1 1 (3.23%) JIRA
General
1 16 (51.61%) Aerospace
2 8 (25.81%) Manufacturing
3 5 (16.13%) Pharmaceutical
4 4 (12.90%) Documentation Skills
5 3 (9.68%) Analytical Skills
6 1 (3.23%) Electronics
6 1 (3.23%) Marketing
6 1 (3.23%) Social Skills
Job Titles
1 11 (35.48%) Senior
2 8 (25.81%) Lead
2 8 (25.81%) Team Leader
3 4 (12.90%) Embedded Engineer
3 4 (12.90%) Embedded Software Engineer
3 4 (12.90%) Machine Learning Scientist
3 4 (12.90%) Network Manager
3 4 (12.90%) Senior Embedded Engineer
3 4 (12.90%) Senior Embedded Software Engineer
3 4 (12.90%) Senior Software Engineer
3 4 (12.90%) Software Engineer
3 4 (12.90%) Software Team Leader
3 4 (12.90%) Systems Engineer
4 3 (9.68%) QA Officer
5 2 (6.45%) Business Development Manager
5 2 (6.45%) Business Manager
5 2 (6.45%) Development Manager
6 1 (3.23%) Product Manager
6 1 (3.23%) Technical Manager
6 1 (3.23%) Technical Product Manager
Libraries, Frameworks & Software Standards
1 1 (3.23%) Vue
Miscellaneous
1 5 (16.13%) Life Science
2 4 (12.90%) Embedded Systems
3 3 (9.68%) Biopharmaceutical
4 2 (6.45%) Driving Licence
5 1 (3.23%) Molecular Biology
5 1 (3.23%) Product Ownership
Operating Systems
1 5 (16.13%) Linux
2 1 (3.23%) Unix
Processes & Methodologies
1 11 (35.48%) Validation
2 9 (29.03%) Software Engineering
3 6 (19.35%) Computer Science
4 5 (16.13%) Agile
4 5 (16.13%) Bioinformatics
5 4 (12.90%) CI/CD
5 4 (12.90%) Commercialisation
5 4 (12.90%) Containerisation
5 4 (12.90%) LLM
5 4 (12.90%) Machine Learning
5 4 (12.90%) Verification and Validation
6 3 (9.68%) Analytics
6 3 (9.68%) CAPA
7 2 (6.45%) Business Development
7 2 (6.45%) Microscopy
7 2 (6.45%) User Experience
8 1 (3.23%) Data Visualisation
8 1 (3.23%) Disruptive Innovation
8 1 (3.23%) Informatics
8 1 (3.23%) Network Management
Programming Languages
1 8 (25.81%) C
2 4 (12.90%) Java
2 4 (12.90%) Python
3 1 (3.23%) JavaScript
Qualifications
1 11 (35.48%) Degree
2 5 (16.13%) Master's Degree
3 4 (12.90%) PhD
Quality Assurance & Compliance
1 3 (9.68%) GMP
1 3 (9.68%) QA
System Software
1 1 (3.23%) Docker
Vendors
1 2 (6.45%) IONA
2 1 (3.23%) Atlassian