AWS Jobs in Reading

Amazon Web Services (AWS)
Berkshire > Reading

The following table provides summary statistics for permanent job vacancies advertised in Reading with a requirement for AWS skills. Included is a benchmarking guide to the salaries offered in vacancies that have cited AWS over the 6 months to 5 May 2024 with a comparison to the same period in the previous 2 years.

6 months to
5 May 2024
Same period 2023 Same period 2022
Rank 15 9 7
Rank change year-on-year -6 -2 -2
Permanent jobs citing AWS 175 259 285
As % of all permanent jobs advertised in Reading 10.31% 16.06% 16.11%
As % of the Cloud Services category 32.59% 37.54% 35.58%
Number of salaries quoted 81 133 201
10th Percentile £42,500 £42,500 £37,500
25th Percentile £53,750 £61,250 £52,500
Median annual salary (50th Percentile) £72,500 £75,000 £70,000
Median % change year-on-year -3.33% +7.14% +7.69%
75th Percentile £83,750 £83,750 £82,500
90th Percentile £90,000 £97,500 £91,250
Berkshire median annual salary £70,000 £70,000 £70,000
% change year-on-year - - +16.67%

All Cloud Skills
Reading

AWS is in the Cloud Services category. The following table is for comparison with the above and provides summary statistics for all permanent job vacancies advertised in Reading with a requirement for cloud computing skills.

Permanent vacancies with a requirement for cloud computing skills 537 690 801
As % of all permanent jobs advertised in Reading 31.63% 42.78% 45.28%
Number of salaries quoted 360 391 509
10th Percentile £27,750 £42,000 £33,500
25th Percentile £40,000 £53,125 £45,000
Median annual salary (50th Percentile) £57,500 £70,000 £65,000
Median % change year-on-year -17.86% +7.69% +8.33%
75th Percentile £72,813 £84,375 £77,500
90th Percentile £86,250 £105,000 £85,000
Berkshire median annual salary £50,000 £65,000 £60,000
% change year-on-year -23.08% +8.33% +4.35%

AWS
Job Vacancy Trend in Reading

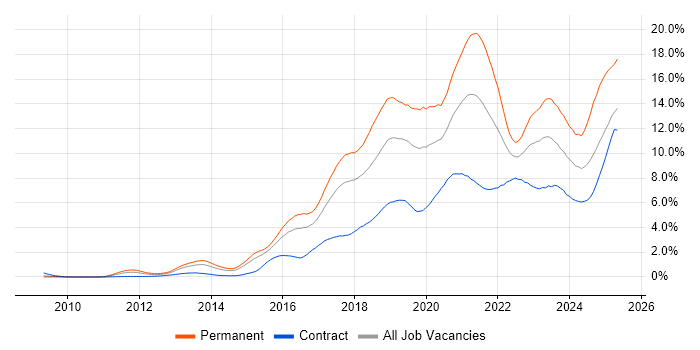
Job postings citing AWS as a proportion of all IT jobs advertised in Reading.

Job vacancy trend for AWS in Reading

AWS
Salary Trend in Reading

3-month moving average salary quoted in jobs citing AWS in Reading.

Salary trend for AWS in Reading

AWS
Salary Histogram in Reading

Salary distribution for jobs citing AWS in Reading over the 6 months to 5 May 2024.

Salary histogram for AWS in Reading

AWS
Co-occurring Skills and Capabilities in Reading by Category

The follow tables expand on the table above by listing co-occurrences grouped by category. The same employment type, locality and period is covered with up to 20 co-occurrences shown in each of the following categories:

Application Platforms
1 29 (16.57%) ArcGIS
1 29 (16.57%) GeoServer
2 28 (16.00%) OpenStack
3 11 (6.29%) Red Hat Fuse
4 10 (5.71%) JBoss
5 4 (2.29%) WebLogic
6 3 (1.71%) Confluence
7 2 (1.14%) Alfresco
7 2 (1.14%) Documentum
7 2 (1.14%) FileNet
7 2 (1.14%) SharePoint
Applications
1 1 (0.57%) Microsoft PowerPoint
Business Applications
1 5 (2.86%) Sparx Enterprise Architect
Cloud Services
1 96 (54.86%) Azure
2 44 (25.14%) Amazon EKS
3 39 (22.29%) Amazon ECS
3 39 (22.29%) Serverless
4 14 (8.00%) SaaS
5 12 (6.86%) GCP
6 9 (5.14%) Microsoft 365
7 7 (4.00%) GitHub
8 6 (3.43%) Amazon EC2
8 6 (3.43%) Amazon SQS
9 4 (2.29%) Cloud Computing
9 4 (2.29%) Firebolt
10 3 (1.71%) Power Platform
11 2 (1.14%) Amazon S3
11 2 (1.14%) Dropbox
11 2 (1.14%) Microsoft Purview
11 2 (1.14%) OneDrive
12 1 (0.57%) AWS Lambda
12 1 (0.57%) Figma
12 1 (0.57%) IaaS
Communications & Networking
1 4 (2.29%) BGP
1 4 (2.29%) DNS
1 4 (2.29%) Firewall
1 4 (2.29%) Internet
1 4 (2.29%) Intrusion Detection
1 4 (2.29%) Network Security
1 4 (2.29%) SSL
1 4 (2.29%) TCP/IP
1 4 (2.29%) VPN
2 1 (0.57%) HTTP
Database & Business Intelligence
1 83 (47.43%) PostgreSQL
2 38 (21.71%) Relational Database
3 30 (17.14%) GIS
4 29 (16.57%) QGIS
5 21 (12.00%) NoSQL
6 13 (7.43%) Oracle Database
7 9 (5.14%) Oracle Database 11g
8 8 (4.57%) RDBMS
9 6 (3.43%) Data Warehouse
10 5 (2.86%) Amazon RDS
10 5 (2.86%) Redis
11 4 (2.29%) Elasticsearch
12 2 (1.14%) Azure SQL Data Warehouse
12 2 (1.14%) Data Lake
13 1 (0.57%) Amazon Redshift
13 1 (0.57%) BigQuery
13 1 (0.57%) Data Vault
13 1 (0.57%) MySQL
13 1 (0.57%) Power BI
13 1 (0.57%) SQL Server
Development Applications
1 58 (33.14%) Jenkins
2 40 (22.86%) Git
3 17 (9.71%) JUnit
4 10 (5.71%) Bitbucket
4 10 (5.71%) JMeter
5 9 (5.14%) JIRA
6 8 (4.57%) Cucumber
7 7 (4.00%) Selenium
8 6 (3.43%) Bitbucket Server
8 6 (3.43%) GitLab
8 6 (3.43%) Serenity BDD
8 6 (3.43%) SoapUI
9 5 (2.86%) Mockito
10 3 (1.71%) Postman
11 2 (1.14%) Gradle
11 2 (1.14%) SonarQube
11 2 (1.14%) TestNG
12 1 (0.57%) Artifactory
12 1 (0.57%) jMock
12 1 (0.57%) Maven
General
1 27 (15.43%) Public Sector
2 15 (8.57%) Social Skills
3 13 (7.43%) Presentation Skills
4 12 (6.86%) Finance
5 9 (5.14%) Analytical Skills
6 4 (2.29%) Banking
7 3 (1.71%) Organisational Skills
8 2 (1.14%) Games
8 2 (1.14%) Marketing
8 2 (1.14%) Telecoms
9 1 (0.57%) Health Technology
Job Titles
1 73 (41.71%) Developer
2 51 (29.14%) Senior
3 49 (28.00%) Java Developer
4 39 (22.29%) Software Engineer
5 26 (14.86%) Senior Developer
6 23 (13.14%) Architect
7 20 (11.43%) Full Stack Developer
8 19 (10.86%) Senior Software Engineer
9 16 (9.14%) Lead
10 14 (8.00%) Full Stack Java Developer
11 12 (6.86%) Senior Java Developer
12 11 (6.29%) DevOps Engineer
13 9 (5.14%) Database Developer
13 9 (5.14%) SC Cleared Java Developer
14 8 (4.57%) PostgreSQL Developer
14 8 (4.57%) Senior Database Developer
14 8 (4.57%) Solutions Architect
15 7 (4.00%) Cloud Architect
16 5 (2.86%) Java Engineer
16 5 (2.86%) Technical Leader
Libraries, Frameworks & Software Standards
1 49 (28.00%) Spring Boot
2 44 (25.14%) React
3 43 (24.57%) Spring
3 43 (24.57%) Web Services
4 42 (24.00%) AngularJS
4 42 (24.00%) REST
5 37 (21.14%) .NET
6 35 (20.00%) Node.js
7 33 (18.86%) Apache Camel
8 29 (16.57%) CSS
8 29 (16.57%) Elastic Stack
8 29 (16.57%) Leaflet
8 29 (16.57%) OpenLayers
8 29 (16.57%) PostGIS
9 25 (14.29%) .NET Core
10 21 (12.00%) JSON
10 21 (12.00%) XML
11 18 (10.29%) Kafka
12 16 (9.14%) RESTful
13 15 (8.57%) SOAP
Miscellaneous
1 33 (18.86%) Distributed Systems
2 12 (6.86%) Public Cloud
3 11 (6.29%) Product Ownership
4 7 (4.00%) Greenfield Project
4 7 (4.00%) PKI
5 6 (3.43%) Private Cloud
6 5 (2.86%) Hybrid Cloud
7 4 (2.29%) Cloud Native
7 4 (2.29%) Data Centre
7 4 (2.29%) Enterprise Software
7 4 (2.29%) Legacy Systems
7 4 (2.29%) Management Information System
8 3 (1.71%) Security Posture
9 2 (1.14%) Data Structures
10 1 (0.57%) CCTV
10 1 (0.57%) Mobile App
10 1 (0.57%) NHS
10 1 (0.57%) Virtual Team
Operating Systems
1 23 (13.14%) Linux
2 5 (2.86%) Ubuntu
3 4 (2.29%) Kali Linux
3 4 (2.29%) Red Hat Enterprise Linux
4 1 (0.57%) Mac OS
4 1 (0.57%) Windows
Processes & Methodologies
1 116 (66.29%) Agile
2 92 (52.57%) DevOps
3 55 (31.43%) Actionable Insight
3 55 (31.43%) Microservices
4 54 (30.86%) Scrum
4 54 (30.86%) Software Engineering
5 44 (25.14%) Kanban
6 42 (24.00%) TDD
7 39 (22.29%) BDD
7 39 (22.29%) Full Stack Development
8 34 (19.43%) Migration
9 33 (18.86%) CI/CD
10 29 (16.57%) Web Development
11 24 (13.71%) SDLC
12 18 (10.29%) BPEL
12 18 (10.29%) Software Testing
12 18 (10.29%) Workflow
13 16 (9.14%) Process Management
14 15 (8.57%) Data Migration
14 15 (8.57%) TOGAF
Programming Languages
1 81 (46.29%) JavaScript
2 76 (43.43%) Java
3 64 (36.57%) Python
4 37 (21.14%) SQL
5 18 (10.29%) C#
6 16 (9.14%) TypeScript
7 12 (6.86%) Groovy
7 12 (6.86%) PL/SQL
7 12 (6.86%) Shell Script
8 9 (5.14%) Kotlin
9 5 (2.86%) Go
10 4 (2.29%) PowerShell
11 2 (1.14%) C
11 2 (1.14%) C++
11 2 (1.14%) Perl
11 2 (1.14%) PHP
12 1 (0.57%) T-SQL
Qualifications
1 83 (47.43%) Security Cleared
2 76 (43.43%) SC Cleared
3 26 (14.86%) AWS Certification
4 21 (12.00%) Azure Certification
5 13 (7.43%) Degree
6 5 (2.86%) Computer Science Degree
7 4 (2.29%) AWS Certified Solutions Architect
7 4 (2.29%) CISSP
8 3 (1.71%) TOGAF Certification
9 2 (1.14%) Master's Degree
10 1 (0.57%) BPSS Clearance
Quality Assurance & Compliance
1 4 (2.29%) ISO/IEC 27001
1 4 (2.29%) ISO/IEC 27002 (supersedes ISO/IEC 17799)
1 4 (2.29%) NIST
1 4 (2.29%) PCI DSS
2 1 (0.57%) Government Security Classifications
2 1 (0.57%) NCSC
2 1 (0.57%) QA
System Software
1 57 (32.57%) Docker
2 20 (11.43%) Hyper-V
Systems Management
1 55 (31.43%) Kubernetes
2 40 (22.86%) Ansible
3 35 (20.00%) Terraform
4 4 (2.29%) Kibana
4 4 (2.29%) Suricata
5 1 (0.57%) Consul
5 1 (0.57%) Netcool
5 1 (0.57%) Packer
5 1 (0.57%) Puppet
5 1 (0.57%) ZABBIX
Vendors
1 29 (16.57%) ESRI
2 28 (16.00%) WSO2
3 19 (10.86%) Oracle
4 14 (8.00%) Microsoft
5 8 (4.57%) Google
5 8 (4.57%) Splunk
6 5 (2.86%) Cisco
6 5 (2.86%) Sparx
7 4 (2.29%) Dynatrace
7 4 (2.29%) Juniper
7 4 (2.29%) Palo Alto
8 3 (1.71%) IBM
9 2 (1.14%) Atlassian
9 2 (1.14%) EMC
9 2 (1.14%) Hyland
9 2 (1.14%) iManage
9 2 (1.14%) Laserfiche
9 2 (1.14%) OpenText
9 2 (1.14%) Salesforce
10 1 (0.57%) AppDynamics