Linux Jobs in Reading

Linux
Berkshire > Reading

The following table provides summary statistics for permanent job vacancies advertised in Reading with a requirement for Linux skills. Included is a benchmarking guide to the salaries offered in vacancies that have cited Linux over the 6 months to 24 April 2024 with a comparison to the same period in the previous 2 years.

6 months to
24 Apr 2024
Same period 2023 Same period 2022
Rank 20 25 24
Rank change year-on-year +5 -1 -6
Permanent jobs citing Linux 151 156 157
As % of all permanent jobs advertised in Reading 8.83% 9.68% 9.04%
As % of the Operating Systems category 47.78% 50.49% 49.06%
Number of salaries quoted 105 92 89
10th Percentile £34,000 £34,875 £37,350
25th Percentile £39,500 £36,250 £47,500
Median annual salary (50th Percentile) £59,000 £59,250 £65,000
Median % change year-on-year -0.42% -8.85% +8.33%
75th Percentile £75,000 £77,500 £76,250
90th Percentile £82,500 £87,500 £81,250
Berkshire median annual salary £58,350 £59,000 £57,500
% change year-on-year -1.10% +2.61% -4.17%

All Operating Systems
Reading

Linux is in the Operating Systems category. The following table is for comparison with the above and provides summary statistics for all permanent job vacancies advertised in Reading with a requirement for operating system skills.

Permanent vacancies with a requirement for operating system skills 316 309 320
As % of all permanent jobs advertised in Reading 18.47% 19.17% 18.42%
Number of salaries quoted 238 174 219
10th Percentile £26,000 £24,300 £27,000
25th Percentile £34,000 £31,313 £38,125
Median annual salary (50th Percentile) £50,675 £50,000 £60,000
Median % change year-on-year +1.35% -16.67% +2.13%
75th Percentile £59,000 £72,500 £73,000
90th Percentile £75,000 £83,500 £81,050
Berkshire median annual salary £50,000 £45,500 £55,000
% change year-on-year +9.89% -17.27% -3.51%

Linux
Job Vacancy Trend in Reading

Job postings citing Linux as a proportion of all IT jobs advertised in Reading.
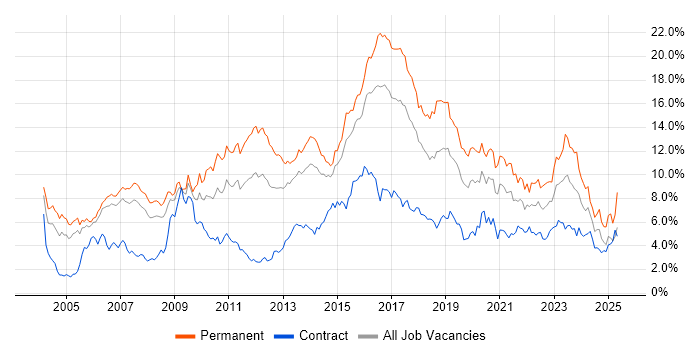
Job vacancy trend for Linux in Reading

Linux
Salary Trend in Reading

3-month moving average salary quoted in jobs citing Linux in Reading.

Salary trend for Linux in Reading

Linux
Salary Histogram in Reading

Salary distribution for jobs citing Linux in Reading over the 6 months to 24 April 2024.

Salary histogram for Linux in Reading

Linux
Co-occurring Skills and Capabilities in Reading by Category

The follow tables expand on the table above by listing co-occurrences grouped by category. The same employment type, locality and period is covered with up to 20 co-occurrences shown in each of the following categories:

Application Platforms
1 19 (12.58%) WebLogic
2 18 (11.92%) Microsoft Exchange
3 15 (9.93%) IIS
3 15 (9.93%) Oracle Service Bus
4 5 (3.31%) Apache
5 4 (2.65%) ArcGIS
5 4 (2.65%) Confluence
5 4 (2.65%) GeoServer
6 1 (0.66%) Red Hat Fuse
Applications
1 15 (9.93%) Microsoft Excel
1 15 (9.93%) Microsoft Office
1 15 (9.93%) MS Visio
Business Applications
1 15 (9.93%) Remedy ITSM
2 4 (2.65%) Sparx Enterprise Architect
Cloud Services
1 67 (44.37%) Azure
2 27 (17.88%) AWS
3 18 (11.92%) Microsoft 365
4 16 (10.60%) Azure Monitor
5 14 (9.27%) Azure Storage
5 14 (9.27%) Entra ID
6 12 (7.95%) OCI
7 8 (5.30%) Amazon EKS
7 8 (5.30%) Amazon S3
8 4 (2.65%) Amazon SQS
8 4 (2.65%) Serverless
9 3 (1.99%) Amazon EC2
9 3 (1.99%) AWS Lambda
9 3 (1.99%) Azure DevOps
10 2 (1.32%) IaaS
10 2 (1.32%) SaaS
11 1 (0.66%) Amazon CloudWatch
11 1 (0.66%) AWS CloudFormation
11 1 (0.66%) GitHub
11 1 (0.66%) Route 53
Communications & Networking
1 52 (34.44%) Firewall
2 47 (31.13%) DNS
3 41 (27.15%) DHCP
4 20 (13.25%) SNMP
5 16 (10.60%) SAN
6 11 (7.28%) VPN
7 7 (4.64%) Internet
7 7 (4.64%) IPsec
8 6 (3.97%) BGP
8 6 (3.97%) LAN
8 6 (3.97%) TCP/IP
8 6 (3.97%) WAN
9 5 (3.31%) Wireshark
10 4 (2.65%) NAS
10 4 (2.65%) Network Security
10 4 (2.65%) SSL
10 4 (2.65%) VoIP
11 2 (1.32%) OSPF
12 1 (0.66%) HTTP
12 1 (0.66%) tcpdump
Database & Business Intelligence
1 19 (12.58%) Oracle Database
2 15 (9.93%) Oracle Database 10g
2 15 (9.93%) Oracle Database 11g
2 15 (9.93%) VLDB
3 8 (5.30%) Relational Database
4 6 (3.97%) Amazon RDS
4 6 (3.97%) Elasticsearch
5 5 (3.31%) GIS
5 5 (3.31%) MongoDB
5 5 (3.31%) PostgreSQL
5 5 (3.31%) RDBMS
6 4 (2.65%) QGIS
7 2 (1.32%) Hadoop
7 2 (1.32%) SQL Server
8 1 (0.66%) Azure SQL Database
8 1 (0.66%) Big Data
8 1 (0.66%) InfluxDB
8 1 (0.66%) MySQL
8 1 (0.66%) Power BI
8 1 (0.66%) Redis
Development Applications
1 18 (11.92%) Jenkins
2 8 (5.30%) JIRA
3 7 (4.64%) Git
4 5 (3.31%) SonarQube
5 4 (2.65%) Artifactory
6 3 (1.99%) Cucumber
6 3 (1.99%) GitLab
7 2 (1.32%) Robot Framework
7 2 (1.32%) Selenium
8 1 (0.66%) Bitbucket
8 1 (0.66%) Eclipse
8 1 (0.66%) Gradle
8 1 (0.66%) IntelliJ
8 1 (0.66%) JUnit
8 1 (0.66%) Maven
General
1 49 (32.45%) Social Skills
2 23 (15.23%) Analytical Skills
3 7 (4.64%) Finance
4 6 (3.97%) Public Sector
5 2 (1.32%) Telecoms
6 1 (0.66%) Aerospace
6 1 (0.66%) Games
Job Titles
1 25 (16.56%) Senior
2 22 (14.57%) Software Engineer
3 20 (13.25%) Senior Software Engineer
4 17 (11.26%) Analyst
4 17 (11.26%) Infrastructure Engineer
5 16 (10.60%) Applications Support
5 16 (10.60%) Windows Engineer
6 15 (9.93%) Applications Support Analyst
6 15 (9.93%) DevOps Engineer
6 15 (9.93%) Oracle Analyst
6 15 (9.93%) Oracle Support Analyst
6 15 (9.93%) SQL Analyst
6 15 (9.93%) SQL Support Analyst
6 15 (9.93%) Support Analyst
6 15 (9.93%) Systems Engineer
6 15 (9.93%) Windows Systems Engineer
7 14 (9.27%) Active Directory Specialist
7 14 (9.27%) Active Directory Support
7 14 (9.27%) Azure Specialist
7 14 (9.27%) Support Specialist
Libraries, Frameworks & Software Standards
1 14 (9.27%) ARM Templates
2 12 (7.95%) RabbitMQ
3 7 (4.64%) React
4 6 (3.97%) OpenMP
5 5 (3.31%) Django
5 5 (3.31%) Spring Boot
5 5 (3.31%) YAML
6 4 (2.65%) Elastic Stack
6 4 (2.65%) Leaflet
6 4 (2.65%) OpenLayers
6 4 (2.65%) PostGIS
6 4 (2.65%) REST
6 4 (2.65%) XML
7 3 (1.99%) JSON
8 2 (1.32%) .NET
8 2 (1.32%) .NET Core
8 2 (1.32%) Qt
8 2 (1.32%) STL
9 1 (0.66%) Dask
9 1 (0.66%) SOAP
Miscellaneous
1 22 (14.57%) Data Centre
2 20 (13.25%) Self-Motivation
3 17 (11.26%) Algorithms
3 17 (11.26%) PKI
4 15 (9.93%) CMDB
5 13 (8.61%) Product Ownership
6 10 (6.62%) IoT
7 6 (3.97%) CUDA
7 6 (3.97%) Public Cloud
8 4 (2.65%) Distributed Systems
8 4 (2.65%) Enterprise Software
9 2 (1.32%) Client/Server
9 2 (1.32%) Virtual Team
10 1 (0.66%) Cyber Kill Chain
10 1 (0.66%) Cyberattack
10 1 (0.66%) Replication
10 1 (0.66%) Smart Meter
Operating Systems
1 67 (44.37%) Windows
2 45 (29.80%) Windows Server
3 34 (22.52%) Unix
4 26 (17.22%) Windows Server 2016
4 26 (17.22%) Windows Server 2019
5 15 (9.93%) Solaris
6 14 (9.27%) Windows Server 2012
7 12 (7.95%) Windows 10
7 12 (7.95%) Windows XP
8 10 (6.62%) Embedded Linux
8 10 (6.62%) Red Hat Enterprise Linux
9 8 (5.30%) Ubuntu
10 5 (3.31%) Data ONTAP
11 2 (1.32%) Debian
11 2 (1.32%) VMS
12 1 (0.66%) CentOS
12 1 (0.66%) Mac OS
Processes & Methodologies
1 64 (42.38%) Agile
2 45 (29.80%) DevOps
3 37 (24.50%) Actionable Insight
4 35 (23.18%) Release Management
5 32 (21.19%) CI/CD
6 29 (19.21%) Problem-Solving
7 28 (18.54%) Performance Tuning
7 28 (18.54%) Software Engineering
8 27 (17.88%) Performance Monitoring
9 26 (17.22%) ITIL
10 25 (16.56%) Software Testing
11 21 (13.91%) Configuration Management
11 21 (13.91%) Project Management
12 20 (13.25%) Artificial Intelligence
13 19 (12.58%) Infrastructure as Code
14 18 (11.92%) Open Source
15 17 (11.26%) Capacity Planning
15 17 (11.26%) Mathematics
15 17 (11.26%) Physics
15 17 (11.26%) Storage Management
Programming Languages
1 52 (34.44%) Python
2 40 (26.49%) PowerShell
3 35 (23.18%) SQL
4 26 (17.22%) Bash
5 19 (12.58%) VBScript
6 18 (11.92%) C++
7 17 (11.26%) C#
7 17 (11.26%) Fortran
8 15 (9.93%) C
8 15 (9.93%) PL/SQL
9 14 (9.27%) Bicep
9 14 (9.27%) Groovy
9 14 (9.27%) VB
10 11 (7.28%) Java
11 10 (6.62%) Perl
12 8 (5.30%) JavaScript
13 3 (1.99%) Shell Script
14 2 (1.32%) Embedded C
Qualifications
1 112 (74.17%) Security Cleared
2 74 (49.01%) SC Cleared
3 66 (43.71%) Degree
4 47 (31.13%) DV Cleared
5 17 (11.26%) PhD
6 16 (10.60%) CCNA
6 16 (10.60%) Cisco Certification
7 14 (9.27%) ITIL Foundation Certificate
8 12 (7.95%) CCNP
9 11 (7.28%) Master's Degree
10 8 (5.30%) AWS Certification
11 6 (3.97%) Computer Science Degree
12 4 (2.65%) AWS Certified Solutions Architect
12 4 (2.65%) Azure Certification
12 4 (2.65%) MCSE
12 4 (2.65%) Microsoft Certification
Quality Assurance & Compliance
1 15 (9.93%) SLA
2 4 (2.65%) QA
3 1 (0.66%) GDPR
3 1 (0.66%) Government Security Classifications
3 1 (0.66%) NCSC
3 1 (0.66%) NIST
System Software
1 48 (31.79%) Active Directory
2 28 (18.54%) VMware Infrastructure
3 27 (17.88%) Docker
4 15 (9.93%) Hyper-V
4 15 (9.93%) Oracle RAC
5 14 (9.27%) Virtual Desktop
5 14 (9.27%) Virtual Machines
5 14 (9.27%) VMware ESXi
6 2 (1.32%) KVM
6 2 (1.32%) QEMU
6 2 (1.32%) Xen
Systems Management
1 41 (27.15%) SCOM
2 40 (26.49%) Kubernetes
3 28 (18.54%) WSUS
4 26 (17.22%) SCCM
5 18 (11.92%) Terraform
6 17 (11.26%) vCenter Server
7 15 (9.93%) Data Guard
7 15 (9.93%) Oracle RMAN
8 14 (9.27%) Active Directory Federation Services
8 14 (9.27%) Microsoft Intune
9 12 (7.95%) Ansible
9 12 (7.95%) EMC NetWorker
9 12 (7.95%) NetBackup
10 6 (3.97%) Prometheus
11 3 (1.99%) Grafana
12 2 (1.32%) Kustomize
12 2 (1.32%) Nessus
12 2 (1.32%) Packer
12 2 (1.32%) SolarWinds Orion
13 1 (0.66%) ZABBIX
Vendors
1 67 (44.37%) Microsoft
2 33 (21.85%) Oracle
3 29 (19.21%) VMware
4 17 (11.26%) Palo Alto
5 15 (9.93%) Dynatrace
5 15 (9.93%) Remedy
5 15 (9.93%) Sun
6 14 (9.27%) Cisco
6 14 (9.27%) Dell
6 14 (9.27%) Juniper
7 12 (7.95%) 3PAR
7 12 (7.95%) EMC
7 12 (7.95%) Extreme Networks
7 12 (7.95%) HP
7 12 (7.95%) Symantec
7 12 (7.95%) Veeam
8 9 (5.96%) Red Hat
9 5 (3.31%) NetApp
9 5 (3.31%) SolidFire
10 4 (2.65%) Sparx