Microsoft Hyper-V
South Yorkshire > Sheffield
The table below provides summary statistics for permanent job vacancies advertised in Sheffield requiring Hyper-V skills. It includes a benchmarking guide to the annual salaries offered in vacancies that cited Hyper-V over the 6 months leading up to 23 May 2025, comparing them to the same period in the previous two years.
| 6 months to 23 May 2025 |
Same period 2024 | Same period 2023 | |
|---|---|---|---|
| Rank | 29 | 48 | 50 |
| Rank change year-on-year | +19 | +2 | +31 |
| Permanent jobs citing Hyper-V | 15 | 38 | 53 |
| As % of all permanent jobs advertised in Sheffield | 5.45% | 3.43% | 5.95% |
| As % of the System Software category | 25.42% | 26.03% | 35.81% |
| Number of salaries quoted | 12 | 35 | 27 |
| 10th Percentile | - | £29,000 | - |
| 25th Percentile | £31,250 | £31,125 | £27,600 |
| Median annual salary (50th Percentile) | £32,500 | £40,000 | £32,200 |
| Median % change year-on-year | -18.75% | +24.22% | +7.51% |
| 75th Percentile | £33,750 | £44,500 | £37,000 |
| 90th Percentile | - | £46,000 | - |
| South Yorkshire median annual salary | £32,500 | £39,000 | £32,200 |
| % change year-on-year | -16.67% | +21.12% | +7.33% |
All System Software Skills
Sheffield
Hyper-V falls under the System Software category. For comparison with the information above, the following table provides summary statistics for all permanent job vacancies requiring system software skills in Sheffield.
| Permanent vacancies with a requirement for system software skills | 59 | 146 | 148 |
| As % of all permanent jobs advertised in Sheffield | 21.45% | 13.19% | 16.61% |
| Number of salaries quoted | 44 | 114 | 96 |
| 10th Percentile | £26,000 | £25,975 | £20,000 |
| 25th Percentile | £28,750 | £29,750 | £24,150 |
| Median annual salary (50th Percentile) | £32,500 | £40,000 | £32,200 |
| Median % change year-on-year | -18.75% | +24.22% | -38.67% |
| 75th Percentile | £35,000 | £51,250 | £48,750 |
| 90th Percentile | £61,000 | £61,250 | £80,000 |
| South Yorkshire median annual salary | £32,500 | £40,000 | £36,000 |
| % change year-on-year | -18.75% | +11.11% | -31.43% |
Hyper-V
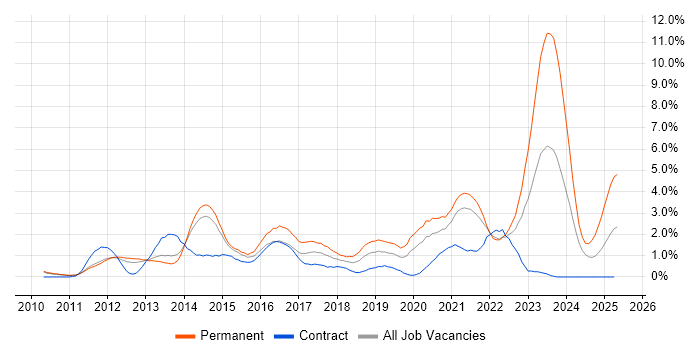
Job Vacancy Trend in Sheffield
Job postings citing Hyper-V as a proportion of all IT jobs advertised in Sheffield.

Hyper-V
Salary Trend in Sheffield
3-month moving average salary quoted in jobs citing Hyper-V in Sheffield.
Hyper-V
Salary Histogram in Sheffield
Salary distribution for jobs citing Hyper-V in Sheffield over the 6 months to 23 May 2025.
Hyper-V
Co-occurring Skills and Capabilities in Sheffield by Category
The follow tables expand on the table above by listing co-occurrences grouped by category. The same employment type, locality and period is covered with up to 20 co-occurrences shown in each of the following categories:
|
|
||||||||||||||||||||||||||||||||||||||||||||||||||||||||||||||||||||||||
|
|
||||||||||||||||||||||||||||||||||||||||||||||||||||||||||||||||||||||||
|
|
||||||||||||||||||||||||||||||||||||||||||||||||||||||||||||||||||||||||
|
|
||||||||||||||||||||||||||||||||||||||||||||||||||||||||||||||||||||||||
|
|
||||||||||||||||||||||||||||||||||||||||||||||||||||||||||||||||||||||||
|
|
||||||||||||||||||||||||||||||||||||||||||||||||||||||||||||||||||||||||
|
|
||||||||||||||||||||||||||||||||||||||||||||||||||||||||||||||||||||||||
|
|
||||||||||||||||||||||||||||||||||||||||||||||||||||||||||||||||||||||||
