Microsoft Excel Jobs in Warrington

Microsoft Excel
Cheshire > Warrington

The following table provides summary statistics for permanent job vacancies advertised in Warrington with a requirement for Microsoft Excel skills. Included is a benchmarking guide to the salaries offered in vacancies that have cited Microsoft Excel over the 6 months to 28 April 2024 with a comparison to the same period in the previous 2 years.

6 months to
28 Apr 2024
Same period 2023 Same period 2022
Rank 15 22 34
Rank change year-on-year +7 +12 +1
Permanent jobs citing Microsoft Excel 52 7 31
As % of all permanent jobs advertised in Warrington 12.41% 3.87% 8.88%
As % of the Applications category 71.23% 36.84% 41.33%
Number of salaries quoted 18 6 12
10th Percentile £22,475 - £31,250
25th Percentile £27,500 £30,500 £32,188
Median annual salary (50th Percentile) £36,601 £39,250 £46,250
Median % change year-on-year -6.75% -15.14% +85.00%
75th Percentile £51,875 £52,500 £77,500
90th Percentile £52,500 £60,000 -
Cheshire median annual salary £37,051 £31,000 £48,167
% change year-on-year +19.52% -35.64% +92.67%

All Software Application Skills
Warrington

Microsoft Excel is in the Software Applications category. The following table is for comparison with the above and provides summary statistics for all permanent job vacancies advertised in Warrington with a requirement for software application skills.

Permanent vacancies with a requirement for software application skills 73 19 75
As % of all permanent jobs advertised in Warrington 17.42% 10.50% 21.49%
Number of salaries quoted 34 17 36
10th Percentile £23,975 £30,500 £25,125
25th Percentile £26,250 £31,250 £30,375
Median annual salary (50th Percentile) £33,250 £42,500 £44,750
Median % change year-on-year -21.76% -5.03% +49.17%
75th Percentile £46,250 £43,750 £53,750
90th Percentile £52,500 £50,750 £75,625
Cheshire median annual salary £34,000 £31,000 £43,500
% change year-on-year +9.68% -28.74% +33.85%

Microsoft Excel
Job Vacancy Trend in Warrington

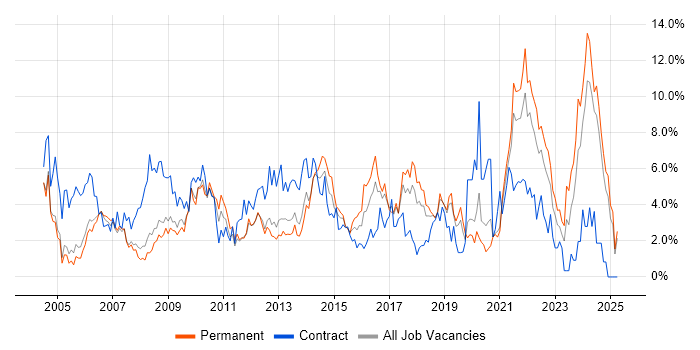
Job postings citing Microsoft Excel as a proportion of all IT jobs advertised in Warrington.

Job vacancy trend for Microsoft Excel in Warrington

Microsoft Excel
Salary Trend in Warrington

3-month moving average salary quoted in jobs citing Microsoft Excel in Warrington.

Salary trend for Microsoft Excel in Warrington

Microsoft Excel
Salary Histogram in Warrington

Salary distribution for jobs citing Microsoft Excel in Warrington over the 6 months to 28 April 2024.

Salary histogram for Microsoft Excel in Warrington

Microsoft Excel
Co-occurring Skills and Capabilities in Warrington by Category

The follow tables expand on the table above by listing co-occurrences grouped by category. The same employment type, locality and period is covered with up to 20 co-occurrences shown in each of the following categories:

Application Platforms
1 5 (9.62%) SharePoint
Applications
1 28 (53.85%) Microsoft PowerPoint
2 5 (9.62%) Microsoft Project
3 4 (7.69%) MS Visio
Business Applications
1 9 (17.31%) SAP BPC
1 9 (17.31%) SAP S/4HANA
2 4 (7.69%) SAP FI
3 1 (1.92%) Dynamics AX
Cloud Services
1 6 (11.54%) Power Platform
2 4 (7.69%) Microsoft 365
3 1 (1.92%) Dynamics 365
Communications & Networking
1 6 (11.54%) Broadband
1 6 (11.54%) Internet
Database & Business Intelligence
1 9 (17.31%) SAP BW
2 6 (11.54%) Power BI
3 5 (9.62%) SQL Server Integration Services
3 5 (9.62%) SQL Server Reporting Services
4 4 (7.69%) PowerPivot
4 4 (7.69%) SQL Server
General
1 45 (86.54%) Social Skills
2 30 (57.69%) Finance
3 29 (55.77%) Retail
4 27 (51.92%) Analytical Skills
5 11 (21.15%) Billing
6 8 (15.38%) Telecoms
7 4 (7.69%) Presentation Skills
7 4 (7.69%) Public Sector
8 1 (1.92%) Publishing
Job Titles
1 11 (21.15%) Quantity Surveyor
2 9 (17.31%) Architect
2 9 (17.31%) SAP Architect
3 8 (15.38%) SAP Financial Architect
3 8 (15.38%) SAP Solutions Architect
3 8 (15.38%) Solutions Architect
4 6 (11.54%) Commercial Director
5 5 (9.62%) Business Intelligence Developer
5 5 (9.62%) Developer
5 5 (9.62%) Power BI Developer
5 5 (9.62%) SSRS Developer
6 4 (7.69%) Administrator
6 4 (7.69%) Lead
6 4 (7.69%) Service Manager
7 3 (5.77%) Analyst
7 3 (5.77%) PMO Lead
8 2 (3.85%) IT Governance Analyst
8 2 (3.85%) Programme Manager
8 2 (3.85%) SAP Manager
8 2 (3.85%) SAP Programme Manager
Miscellaneous
1 24 (46.15%) Self-Motivation
2 4 (7.69%) Analytical Mindset
3 1 (1.92%) Onboarding
Processes & Methodologies
1 15 (28.85%) ERP
1 15 (28.85%) Stakeholder Management
2 14 (26.92%) Problem-Solving
3 13 (25.00%) Process Improvement
4 11 (21.15%) Agile
4 11 (21.15%) Coaching
4 11 (21.15%) Contract Management
4 11 (21.15%) Data Management
5 10 (19.23%) Continuous Improvement
6 9 (17.31%) Business Process Improvement
6 9 (17.31%) Decision-Making
6 9 (17.31%) SAP Implementation
7 6 (11.54%) Business Intelligence
8 5 (9.62%) Data Science
8 5 (9.62%) Data Security
8 5 (9.62%) ETL
8 5 (9.62%) ITIL
8 5 (9.62%) Service Delivery
8 5 (9.62%) Visualisation
8 5 (9.62%) Waterfall
Programming Languages
1 5 (9.62%) SQL
1 5 (9.62%) T-SQL
Qualifications
1 11 (21.15%) ACCA
1 11 (21.15%) CIMA
2 10 (19.23%) Degree
3 4 (7.69%) SC Cleared
3 4 (7.69%) Security Cleared
4 1 (1.92%) ITIL Certification
Quality Assurance & Compliance
1 8 (15.38%) ISO/IEC 27001
2 6 (11.54%) GDPR
3 4 (7.69%) Cyber Essentials
4 3 (5.77%) PMO
Vendors
1 17 (32.69%) Virgin Media
2 14 (26.92%) SAP
3 12 (23.08%) Microsoft
4 11 (21.15%) NEC
5 5 (9.62%) Alteryx
6 1 (1.92%) Progress