Inclusion and Diversity Job Trends in the UK excluding London

Inclusion and Diversity
UK > UK excluding London

The table below looks at the prevalence of the term Inclusion and Diversity in permanent job vacancies in the UK excluding London. Included is a benchmarking guide to the salaries offered in vacancies that cited Inclusion and Diversity over the 6 months leading up to 26 November 2025, comparing them to the same period in the previous two years.

6 months to
26 Nov 2025
Same period 2024 Same period 2023
Rank 19 36 42
Rank change year-on-year +17 +6 -2
Permanent jobs citing Inclusion and Diversity 2,559 2,387 1,730
As % of all permanent jobs in the UK excluding London 6.88% 5.07% 5.86%
As % of the General category 11.72% 8.90% 9.25%
Number of salaries quoted 520 529 741
10th Percentile £20,000 £32,100 £32,500
25th Percentile £27,707 £41,250 £40,000
Median annual salary (50th Percentile) £39,715 £55,000 £55,000
Median % change year-on-year -27.79% - +3.14%
75th Percentile £60,000 £69,800 £69,800
90th Percentile £78,750 £79,600 £83,750
UK median annual salary £50,000 £62,500 £65,000
% change year-on-year -20.00% -3.85% +5.77%

All General Skills
UK excluding London

Inclusion and Diversity falls under the General Skills category. For comparison with the information above, the following table provides summary statistics for all permanent job vacancies requiring common skills in the UK excluding London.

Permanent vacancies with a requirement for common skills 21,826 26,824 18,712
As % of all permanent jobs advertised in the UK excluding London 58.65% 57.03% 63.43%
Number of salaries quoted 12,409 11,641 13,594
10th Percentile £26,250 £30,000 £26,500
25th Percentile £31,250 £38,750 £36,250
Median annual salary (50th Percentile) £45,000 £51,422 £50,000
Median % change year-on-year -12.49% +2.84% -4.76%
75th Percentile £62,500 £67,500 £67,500
90th Percentile £77,550 £82,500 £81,850
UK median annual salary £52,500 £60,000 £60,000
% change year-on-year -12.50% - -

Inclusion and Diversity
Job Vacancy Trend in the UK excluding London

Historical trend showing the proportion of permanent IT job postings citing Inclusion and Diversity relative to all permanent IT jobs advertised in the UK excluding London.
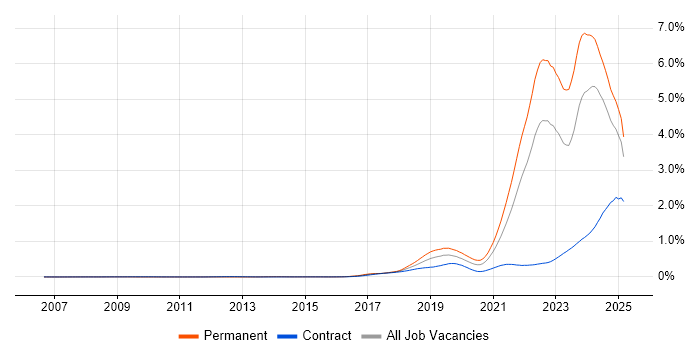
Inclusion and Diversity job vacancy trend in the UK excluding London

Inclusion and Diversity
Salary Trend in the UK excluding London

Salary distribution trend for jobs in the UK excluding London citing Inclusion and Diversity.

Salary distribution trend for jobs in the UK excluding London citing Inclusion and Diversity

Inclusion and Diversity
Salary Histogram in the UK excluding London

Salary distribution for jobs citing Inclusion and Diversity in the UK excluding London over the 6 months to 26 November 2025.

Salary histogram for Inclusion and Diversity in the UK excluding London

Inclusion and Diversity
Job Locations in the UK excluding London

The table below looks at the demand and provides a guide to the median salaries quoted in IT jobs citing Inclusion and Diversity within the UK excluding London region over the 6 months to 26 November 2025. The 'Rank Change' column provides an indication of the change in demand within each location based on the same 6 month period last year.

Location Rank Change
on Same Period
Last Year
Matching
Permanent
IT Job Ads
Median Salary
Past 6 Months
Median Salary
% Change
on Same Period
Last Year
Live
Jobs
North of England +28 898 £33,000 -40.00% 167
North West +21 769 £33,355 -41.17% 101
South East +18 653 £52,500 -12.50% 441
East of England +9 291 £57,000 +26.67% 66
Midlands +18 283 £47,500 -7.22% 156
Scotland -13 205 £25,835 -53.03% 106
South West -2 185 £28,500 -32.94% 77
West Midlands +26 180 £53,750 +2.38% 93
Yorkshire +14 114 £30,250 -39.50% 38
East Midlands +22 103 £35,000 -12.50% 59
Wales +3 34 £57,500 -3.25% 27
North East -4 15 £27,500 -57.69% 28
Northern Ireland -12 10 £76,024 +16.96% 24
Channel Islands - 6 - - 1
Isle of Man - 2 £32,000 -
Inclusion and Diversity
UK

Inclusion and Diversity
Co-Occurring Skills & Capabilities in the UK excluding London by Category

The following tables expand on the one above by listing co-occurrences grouped by category. They cover the same employment type, locality and period, with up to 20 co-occurrences shown in each category:

Application Platforms
1 19 (0.74%) Apache Spark
2 18 (0.70%) SharePoint
3 10 (0.39%) Apache
4 6 (0.23%) Camunda
4 6 (0.23%) CMS
4 6 (0.23%) Oracle Workflow
5 3 (0.12%) Cloud Foundry
5 3 (0.12%) Tomcat
6 2 (0.078%) Apache Airflow
6 2 (0.078%) ArcGIS
6 2 (0.078%) Microsoft Exchange
7 1 (0.039%) Drupal
7 1 (0.039%) HCL Notes
7 1 (0.039%) Oracle SOA Suite
7 1 (0.039%) WebLogic
7 1 (0.039%) WordPress
Applications
1 68 (2.66%) Microsoft Office
2 55 (2.15%) Microsoft Excel
3 16 (0.63%) AutoCAD
4 13 (0.51%) Microsoft PowerPoint
5 6 (0.23%) Microsoft Project
5 6 (0.23%) Revit
6 5 (0.20%) Adobe After Effects
6 5 (0.20%) Adobe Creative Suite
6 5 (0.20%) Adobe Premiere
6 5 (0.20%) Photoshop
7 4 (0.16%) Adobe XD
7 4 (0.16%) Civil 3D
8 3 (0.12%) Navisworks
8 3 (0.12%) Simulink
8 3 (0.12%) Spreadsheet
9 2 (0.078%) MS Visio
10 1 (0.039%) MicroStation
10 1 (0.039%) ProjectWise
10 1 (0.039%) SmartSuite
Business Applications
1 15 (0.59%) NetSuite
2 7 (0.27%) Oracle Payables
3 5 (0.20%) Dynamics CRM
4 3 (0.12%) Salesforce CRM
5 2 (0.078%) Dynamics NAV
5 2 (0.078%) Integrated Workplace Management System
5 2 (0.078%) Sage X3
6 1 (0.039%) Elite 3E
6 1 (0.039%) Infor M3
6 1 (0.039%) Misys Midas
6 1 (0.039%) Oracle BPM
6 1 (0.039%) Oracle EBS
6 1 (0.039%) Primavera
6 1 (0.039%) Sparx Enterprise Architect
6 1 (0.039%) TRIRIGA
Cloud Services
1 1,338 (52.29%) Cloud Computing
2 105 (4.10%) AWS
3 86 (3.36%) Azure
4 73 (2.85%) Microsoft 365
5 50 (1.95%) Power Platform
6 30 (1.17%) SaaS
7 25 (0.98%) Entra ID
8 19 (0.74%) GCP
9 14 (0.55%) AWS Lambda
9 14 (0.55%) Serverless
10 13 (0.51%) Amazon S3
11 11 (0.43%) Amazon EKS
12 9 (0.35%) Amazon ECS
12 9 (0.35%) Dynamics 365
12 9 (0.35%) Google Analytics
13 7 (0.27%) Azure Monitor
13 7 (0.27%) GitHub
13 7 (0.27%) npm
13 7 (0.27%) PaaS
14 6 (0.23%) OneDrive
Communications & Networking
1 1,353 (52.87%) Internet
2 23 (0.90%) LAN
3 19 (0.74%) Firewall
3 19 (0.74%) WAN
4 16 (0.63%) Broadband
5 15 (0.59%) VPN
6 12 (0.47%) DNS
7 10 (0.39%) Wi-Fi
8 9 (0.35%) DHCP
9 5 (0.20%) TCP/IP
10 3 (0.12%) HTTP
10 3 (0.12%) Modbus
10 3 (0.12%) MPLS
10 3 (0.12%) VLAN
10 3 (0.12%) Wireless
11 2 (0.078%) ADSL
11 2 (0.078%) Cisco Firepower
11 2 (0.078%) Cisco Nexus
11 2 (0.078%) Network Security
11 2 (0.078%) SAN
Database & Business Intelligence
1 42 (1.64%) Power BI
2 21 (0.82%) NoSQL
3 19 (0.74%) Big Data
4 17 (0.66%) Relational Database
5 15 (0.59%) Tableau
6 12 (0.47%) Amazon Athena
6 12 (0.47%) PostgreSQL
6 12 (0.47%) SQL Server
7 11 (0.43%) Apache Cassandra
8 10 (0.39%) Power Query
9 9 (0.35%) Elasticsearch
9 9 (0.35%) KDB
9 9 (0.35%) Kdb+
10 8 (0.31%) GIS
10 8 (0.31%) Oracle Database
11 7 (0.27%) Apache Hive
11 7 (0.27%) MySQL
12 6 (0.23%) Amazon Redshift
12 6 (0.23%) Hadoop
12 6 (0.23%) RDBMS
Development Applications
1 37 (1.45%) Jenkins
2 27 (1.06%) JIRA
3 21 (0.82%) Git
4 15 (0.59%) GitLab
4 15 (0.59%) SonarQube
5 14 (0.55%) JUnit
5 14 (0.55%) Maven
6 11 (0.43%) Cypress.io
7 10 (0.39%) Selenium
8 8 (0.31%) webpack
9 5 (0.20%) Gradle
9 5 (0.20%) Vite
10 4 (0.16%) Axure RP
10 4 (0.16%) Balsamiq
10 4 (0.16%) WebDriver
11 3 (0.12%) Locust
11 3 (0.12%) Rational DOORS
11 3 (0.12%) Rational Rhapsody
11 3 (0.12%) Subversion
12 2 (0.078%) Visual Studio Code
General
1 1,728 (67.53%) Social Skills
2 1,430 (55.88%) Banking
3 393 (15.36%) Finance
4 238 (9.30%) Law
5 186 (7.27%) Marketing
6 145 (5.67%) Retail
7 135 (5.28%) Analytical Skills
8 133 (5.20%) Public Sector
9 62 (2.42%) Organisational Skills
10 54 (2.11%) Legal
11 35 (1.37%) Telecoms
12 26 (1.02%) Pharmaceutical
13 24 (0.94%) Influencing Skills
14 19 (0.74%) Presentation Skills
15 18 (0.70%) Games
16 17 (0.66%) French Language
17 16 (0.63%) Automotive
17 16 (0.63%) Manufacturing
18 15 (0.59%) Investment Banking
18 15 (0.59%) Swedish Language
Job Titles
1 1,072 (41.89%) Lecturer
2 180 (7.03%) Senior
3 162 (6.33%) Software Engineer
4 129 (5.04%) Lead
5 88 (3.44%) Java Engineer
6 85 (3.32%) Java Software Engineer
7 81 (3.17%) Analyst
8 79 (3.09%) Senior Manager
9 63 (2.46%) Microsoft Specialist
10 59 (2.31%) Project Engineer
11 56 (2.19%) Sales Manager
12 52 (2.03%) Architect
13 46 (1.80%) Account Manager
14 45 (1.76%) Sales Account Manager
14 45 (1.76%) Senior Account Manager
14 45 (1.76%) Senior Sales Manager
15 44 (1.72%) Lead Software Engineer
16 39 (1.52%) Support Engineer
17 37 (1.45%) Developer
18 35 (1.37%) Python Engineer
Libraries, Frameworks & Software Standards
1 84 (3.28%) Spring
2 65 (2.54%) React
3 53 (2.07%) Kafka
4 49 (1.91%) REST
5 46 (1.80%) Spring Boot
6 28 (1.09%) HTML
7 26 (1.02%) AngularJS
7 26 (1.02%) EDI
8 24 (0.94%) CSS
9 22 (0.86%) SOAP
10 21 (0.82%) RESTful
11 19 (0.74%) Lightning Web Components
11 19 (0.74%) Node.js
11 19 (0.74%) Visualforce
12 17 (0.66%) Web Services
13 13 (0.51%) .NET
14 11 (0.43%) PySpark
15 10 (0.39%) Django
16 9 (0.35%) Hibernate
17 8 (0.31%) SAML
Miscellaneous
1 1,338 (52.29%) IoT
2 68 (2.66%) Blog
2 68 (2.66%) Onboarding
3 64 (2.50%) Algorithms
4 56 (2.19%) Cloud Native
5 52 (2.03%) Driving Licence
6 36 (1.41%) Management Information System
7 32 (1.25%) Data Centre
8 31 (1.21%) Self-Motivation
9 28 (1.09%) Product Ownership
10 22 (0.86%) Social Media
11 21 (0.82%) Public Cloud
12 18 (0.70%) Microsoft Licensing
13 16 (0.63%) Enterprise Software
14 14 (0.55%) FMCG
15 13 (0.51%) Podcast
16 12 (0.47%) Reference Data
16 12 (0.47%) Renewable Energy
17 10 (0.39%) Foreign Exchange (FX)
17 10 (0.39%) Legacy Systems
Operating Systems
1 42 (1.64%) Windows
2 12 (0.47%) Linux
3 9 (0.35%) Windows 10
4 8 (0.31%) Apple iOS
4 8 (0.31%) Unix
5 6 (0.23%) Android
5 6 (0.23%) Windows Server
6 3 (0.12%) Mac OS
6 3 (0.12%) Red Hat Enterprise Linux
6 3 (0.12%) Ubuntu
7 2 (0.078%) Embedded Linux
8 1 (0.039%) Debian
8 1 (0.039%) OpenWrt
8 1 (0.039%) Windows Server 2016
8 1 (0.039%) Windows Server 2019
Processes & Methodologies
1 1,683 (65.77%) AI
2 1,434 (56.04%) Machine Learning
3 1,429 (55.84%) Cybersecurity
4 1,359 (53.11%) User Experience
5 1,346 (52.60%) Web Development
6 286 (11.18%) Agile
7 216 (8.44%) Continuous Improvement
8 208 (8.13%) Problem-Solving
9 191 (7.46%) Software Engineering
10 175 (6.84%) Customer Service
11 157 (6.14%) CI/CD
12 146 (5.71%) Decision-Making
12 146 (5.71%) SDLC
13 131 (5.12%) Operational Stability
14 118 (4.61%) Community of Practice
15 113 (4.42%) B2B
16 108 (4.22%) CRM
17 101 (3.95%) Mentoring
18 98 (3.83%) Visualisation
19 94 (3.67%) Coaching
Programming Languages
1 137 (5.35%) Java
2 89 (3.48%) SQL
3 85 (3.32%) Python
4 50 (1.95%) JavaScript
5 19 (0.74%) Apex Code
5 19 (0.74%) TypeScript
6 16 (0.63%) C#
7 15 (0.59%) SOQL
7 15 (0.59%) SOSL
8 11 (0.43%) PowerShell
9 10 (0.39%) Data Analysis Expressions
10 6 (0.23%) Go
10 6 (0.23%) PL/SQL
11 4 (0.16%) PHP
11 4 (0.16%) R
12 3 (0.12%) C++
12 3 (0.12%) MATLAB
12 3 (0.12%) Scala
12 3 (0.12%) T-SQL
13 2 (0.078%) Ruby
Qualifications
1 1,682 (65.73%) Degree
2 1,337 (52.25%) Master's Degree
3 1,334 (52.13%) Postgraduate
4 1,333 (52.09%) PhD
5 42 (1.64%) Security Cleared
6 36 (1.41%) SC Cleared
7 26 (1.02%) DBS Check
7 26 (1.02%) PMP
8 18 (0.70%) Microsoft Certification
9 17 (0.66%) HNC
10 16 (0.63%) MCSE
11 15 (0.59%) Computer Science Degree
12 11 (0.43%) Chartered Engineer
13 10 (0.39%) HND
14 9 (0.35%) CISSP
15 8 (0.31%) Azure Certification
15 8 (0.31%) City & Guilds
16 7 (0.27%) CISM
17 6 (0.23%) BPSS Clearance
17 6 (0.23%) PMI Certification
Quality Assurance & Compliance
1 32 (1.25%) QA
2 29 (1.13%) SLA
3 20 (0.78%) Accessibility
4 19 (0.74%) ISO/IEC 27001
5 18 (0.70%) NIST
6 17 (0.66%) Cyber Essentials
6 17 (0.66%) PMO
7 14 (0.55%) GDPR
8 12 (0.47%) Data Quality
9 7 (0.27%) Cyber Essentials PLUS
10 5 (0.20%) COBIT
11 4 (0.16%) EU AI Act
11 4 (0.16%) ISO 19650
11 4 (0.16%) PCI DSS
11 4 (0.16%) WCAG
12 2 (0.078%) GRC
12 2 (0.078%) NCSC
12 2 (0.078%) P3O
12 2 (0.078%) SOC 2
13 1 (0.039%) ISO 22301
System Software
1 42 (1.64%) Active Directory
2 19 (0.74%) Docker
3 15 (0.59%) VMware Infrastructure
4 4 (0.16%) HDFS
5 3 (0.12%) Virtual Servers
6 2 (0.078%) Hyper-V
6 2 (0.078%) Microsoft Virtual Server
6 2 (0.078%) VMware ESXi
7 1 (0.039%) iptables
7 1 (0.039%) Virtual Machines
Systems Management
1 50 (1.95%) Kubernetes
2 35 (1.37%) Terraform
3 17 (0.66%) Microsoft Intune
4 12 (0.47%) Grafana
5 11 (0.43%) Ansible
6 6 (0.23%) Single Sign-On
7 4 (0.16%) Argo
7 4 (0.16%) Prometheus
8 3 (0.12%) ITRS Geneos
8 3 (0.12%) Netcool
8 3 (0.12%) Netcool/OMNIbus
8 3 (0.12%) SCCM
8 3 (0.12%) Systems Management Server (SMS)
8 3 (0.12%) Tivoli
9 2 (0.078%) CASB
9 2 (0.078%) Nessus
10 1 (0.039%) CSIRT
10 1 (0.039%) Jamf Pro
10 1 (0.039%) Nagios
Vendors
1 260 (10.16%) Microsoft
2 61 (2.38%) Cisco
3 52 (2.03%) Oracle
4 46 (1.80%) Salesforce
5 36 (1.41%) NEC
6 35 (1.37%) Splunk
7 33 (1.29%) Adobe
8 27 (1.06%) Apple
8 27 (1.06%) Palo Alto
9 23 (0.90%) Google
10 21 (0.82%) Databricks
11 17 (0.66%) ServiceNow
11 17 (0.66%) VMware
12 16 (0.63%) Dell
13 14 (0.55%) SAP
14 13 (0.51%) Dynatrace
14 13 (0.51%) Juniper
15 12 (0.47%) Autodesk
16 10 (0.39%) Fortinet
17 9 (0.35%) McAfee