Continuous Improvement Jobs with Work from Home Options

Continual Improvement
UK > Work from Home

The table below provides summary statistics for permanent job vacancies with an option to work from home (WFH) and a requirement for Continuous Improvement skills. Included is a benchmarking guide to the salaries offered in vacancies that have cited Continuous Improvement over the 6 months to 6 May 2024 with a comparison to the same period in the previous 2 years.

6 months to
6 May 2024
Same period 2023 Same period 2022
Rank 55 59 67
Rank change year-on-year +4 +8 +45
Permanent jobs citing Continuous Improvement 1,612 2,198 3,429
As % of all permanent jobs with a WFH option 4.76% 5.19% 5.01%
As % of the Processes & Methodologies category 5.20% 5.40% 5.17%
Number of salaries quoted 1,207 1,528 1,912
10th Percentile £33,455 £30,500 £36,298
25th Percentile £42,560 £42,500 £46,000
Median annual salary (50th Percentile) £61,000 £59,526 £60,000
Median % change year-on-year +2.48% -0.79% +9.09%
75th Percentile £80,435 £80,000 £75,000
90th Percentile £96,366 £100,000 £90,000
UK median annual salary £57,500 £60,000 £60,000
% change year-on-year -4.17% - +9.09%

All Process and Methodology Skills
Work from Home

Continuous Improvement is in the Processes and Methodologies category. The following table is for comparison with the above and provides summary statistics for all permanent job vacancies with a WFH option and a requirement for process or methodology skills.

Permanent vacancies with a requirement for process or methodology skills 31,014 40,730 66,290
As % of all permanent jobs with a WFH option 91.60% 96.10% 96.92%
Number of salaries quoted 23,557 28,305 41,490
10th Percentile £33,750 £37,500 £36,250
25th Percentile £42,500 £47,500 £45,750
Median annual salary (50th Percentile) £57,500 £62,500 £60,000
Median % change year-on-year -8.00% +4.17% +9.09%
75th Percentile £75,000 £82,500 £80,000
90th Percentile £95,000 £100,000 £95,000
UK median annual salary £55,000 £61,500 £60,000
% change year-on-year -10.57% +2.50% +9.09%

Continuous Improvement
Trend for Jobs with a WFH Option

Job vacancies with a work from home option citing Continuous Improvement as a proportion of all IT jobs advertised.
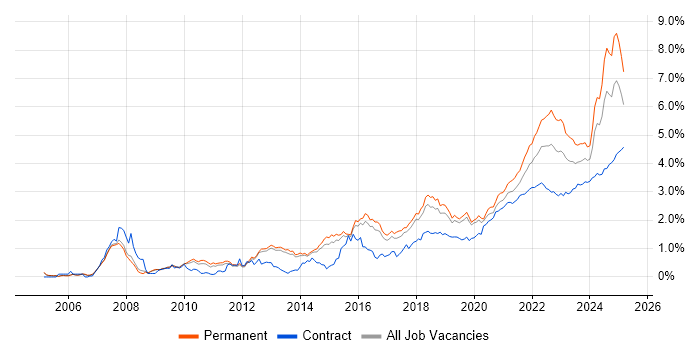
Continuous Improvement trend for jobs with a WFH option

Continuous Improvement
Salary Trend for Jobs with a WFH Option

3-month moving average salary quoted in job vacancies with a work from home option citing Continuous Improvement.

Continuous Improvement salary trend for jobs with a WFH option

Continuous Improvement
Salary Histogram for Jobs with a WFH Option

Salary distribution for jobs with a work from home option citing Continuous Improvement over the 6 months to 6 May 2024.

Continuous Improvement salary histogram for jobs with a WFH option

Continuous Improvement
Co-occurring Skills and Capabilities with WFH Options by Category

The follow tables expand on the table above by listing co-occurrences grouped by category. The same employment type, locality and period is covered with up to 20 co-occurrences shown in each of the following categories:

Application Platforms
1 61 (3.78%) SharePoint
2 43 (2.67%) Microsoft Exchange
3 30 (1.86%) Confluence
3 30 (1.86%) SAS
4 16 (0.99%) CMS
5 14 (0.87%) IIS
6 13 (0.81%) nginx
7 8 (0.50%) WordPress
8 5 (0.31%) Appian
9 4 (0.25%) Apache
10 2 (0.12%) Apache Airflow
10 2 (0.12%) Apache Solr
10 2 (0.12%) Apache Spark
10 2 (0.12%) BizTalk Server
10 2 (0.12%) Drupal
10 2 (0.12%) Kentico
10 2 (0.12%) Sitecore CMS
11 1 (0.062%) Luigi
11 1 (0.062%) Umbraco
Applications
1 120 (7.44%) Microsoft Excel
2 103 (6.39%) Microsoft Office
3 52 (3.23%) Microsoft PowerPoint
4 14 (0.87%) Microsoft Project
5 12 (0.74%) MS Visio
6 5 (0.31%) Spreadsheet
7 4 (0.25%) AutoCAD
7 4 (0.25%) Chatbot
7 4 (0.25%) Trello
8 1 (0.062%) Acrobat
8 1 (0.062%) Adobe XD
8 1 (0.062%) Notion
8 1 (0.062%) Oracle Smart View
8 1 (0.062%) Photoshop
8 1 (0.062%) Sketch
Business Applications
1 19 (1.18%) Dynamics CRM
2 14 (0.87%) SAP S/4HANA
3 12 (0.74%) iTrent
4 11 (0.68%) NEC Housing
5 10 (0.62%) Infor SunSystems
6 8 (0.50%) Oracle ERP
6 8 (0.50%) Salesforce CRM
7 7 (0.43%) Remedy ITSM
8 6 (0.37%) SAP ERP
9 5 (0.31%) NetSuite
9 5 (0.31%) Sage 200
10 4 (0.25%) Dynamics NAV
10 4 (0.25%) Shopify
10 4 (0.25%) Visualfiles
11 3 (0.19%) Oracle Receivables
11 3 (0.19%) SAP CO
11 3 (0.19%) SAP FI
11 3 (0.19%) SAP FI/CO
12 2 (0.12%) SAP CX
12 2 (0.12%) SAP MM
Cloud Services
1 364 (22.58%) Azure
2 186 (11.54%) Power Platform
3 158 (9.80%) AWS
4 141 (8.75%) Microsoft 365
5 80 (4.96%) GCP
6 71 (4.40%) Azure DevOps
6 71 (4.40%) SaaS
7 57 (3.54%) Dynamics 365
8 48 (2.98%) Serverless
9 42 (2.61%) Entra ID
10 40 (2.48%) PowerApps
11 37 (2.30%) Power Automate
12 35 (2.17%) Matillion
13 32 (1.99%) Azure Data Factory
14 28 (1.74%) Snowflake
15 26 (1.61%) GitHub
16 24 (1.49%) Amazon S3
17 21 (1.30%) Azure Monitor
18 18 (1.12%) PaaS
19 17 (1.05%) IaaS
Communications & Networking
1 46 (2.85%) DNS
2 35 (2.17%) Firewall
3 31 (1.92%) TCP/IP
4 25 (1.55%) LAN
5 24 (1.49%) Wi-Fi
6 22 (1.36%) Broadband
6 22 (1.36%) HTTP
7 21 (1.30%) WAN
8 16 (0.99%) Internet
9 12 (0.74%) Remote Desktop
9 12 (0.74%) tcpdump
10 11 (0.68%) SAN
10 11 (0.68%) SNMP
11 10 (0.62%) DHCP
12 9 (0.56%) Ethernet
12 9 (0.56%) RS-232
12 9 (0.56%) VPN
13 8 (0.50%) FTP
14 7 (0.43%) VLAN
15 6 (0.37%) Cisco IPT
Database & Business Intelligence
1 151 (9.37%) Power BI
2 101 (6.27%) SQL Server
3 49 (3.04%) Tableau
4 44 (2.73%) Data Warehouse
5 38 (2.36%) Data Lake
6 35 (2.17%) MySQL
7 33 (2.05%) Relational Database
8 29 (1.80%) MongoDB
9 28 (1.74%) Metadata
10 19 (1.18%) NoSQL
11 15 (0.93%) Elasticsearch
11 15 (0.93%) SQL Server Reporting Services
12 14 (0.87%) InfluxDB
13 12 (0.74%) RDBMS
14 11 (0.68%) Amazon RDS
14 11 (0.68%) PostgreSQL
15 10 (0.62%) BusinessObjects
15 10 (0.62%) SQL Server Integration Services
16 9 (0.56%) Data Hub
17 8 (0.50%) Big Data
Development Applications
1 80 (4.96%) JIRA
2 72 (4.47%) Git
3 57 (3.54%) Jenkins
4 23 (1.43%) TeamCity
5 14 (0.87%) Visual Studio
6 13 (0.81%) Cypress.io
7 11 (0.68%) Bitbucket
7 11 (0.68%) Selenium
8 10 (0.62%) Eclipse
9 9 (0.56%) MLflow
9 9 (0.56%) Postman
10 8 (0.50%) GitLab
10 8 (0.50%) webpack
11 6 (0.37%) Mocha
11 6 (0.37%) Octopus Deploy
12 5 (0.31%) Android Studio
12 5 (0.31%) Maven
12 5 (0.31%) SoapUI
12 5 (0.31%) Spinnaker
13 4 (0.25%) Sonatype Nexus
General
1 695 (43.11%) Social Skills
2 456 (28.29%) Finance
3 302 (18.73%) Analytical Skills
4 143 (8.87%) Legal
5 106 (6.58%) Inclusion and Diversity
5 106 (6.58%) Retail
6 105 (6.51%) Public Sector
7 86 (5.33%) Banking
8 58 (3.60%) Marketing
9 56 (3.47%) Law
10 44 (2.73%) Presentation Skills
11 40 (2.48%) Organisational Skills
12 39 (2.42%) Manufacturing
13 33 (2.05%) Electronics
14 31 (1.92%) Influencing Skills
15 26 (1.61%) Local Government
16 25 (1.55%) Telecoms
17 23 (1.43%) Pharmaceutical
18 20 (1.24%) Fire and Rescue
19 19 (1.18%) Military
Job Titles
1 264 (16.38%) Lead
2 248 (15.38%) Senior
3 246 (15.26%) Developer
4 240 (14.89%) Analyst
5 77 (4.78%) Senior Developer
6 64 (3.97%) Architect
7 56 (3.47%) Software Developer
8 54 (3.35%) Project Manager
9 50 (3.10%) IT Manager
10 47 (2.92%) Consultant
11 46 (2.85%) DevOps Engineer
12 44 (2.73%) Infrastructure Engineer
13 42 (2.61%) Senior Manager
14 41 (2.54%) Lead Developer
15 35 (2.17%) Software Engineer
16 32 (1.99%) Azure Engineer
16 32 (1.99%) C# Developer
16 32 (1.99%) Data Engineer
16 32 (1.99%) Solutions Architect
17 31 (1.92%) Business Analyst
Libraries, Frameworks & Software Standards
1 118 (7.32%) .NET
2 78 (4.84%) HTML
3 73 (4.53%) CSS
4 71 (4.40%) RESTful
5 65 (4.03%) React
6 48 (2.98%) AngularJS
7 44 (2.73%) Web Services
8 35 (2.17%) XML
9 32 (1.99%) Node.js
10 30 (1.86%) .NET Framework
11 27 (1.67%) JSON
12 26 (1.61%) Twitter Bootstrap
13 24 (1.49%) ASP.NET
14 22 (1.36%) JWT
15 21 (1.30%) PySpark
16 19 (1.18%) Entity Framework
17 18 (1.12%) Kafka
17 18 (1.12%) RabbitMQ
17 18 (1.12%) Spring
18 17 (1.05%) EDI
Miscellaneous
1 103 (6.39%) Management Information System
2 85 (5.27%) Product Ownership
3 67 (4.16%) Self-Motivation
4 48 (2.98%) Cloud Native
5 37 (2.30%) Onboarding
6 36 (2.23%) Clustering
6 36 (2.23%) Mobile App
7 33 (2.05%) CMDB
8 31 (1.92%) Enterprise Software
9 30 (1.86%) Social Media
10 27 (1.67%) Data Centre
11 22 (1.36%) Legacy Systems
12 21 (1.30%) Data Structures
13 20 (1.24%) Driving Licence
13 20 (1.24%) Virtual Team
14 19 (1.18%) Greenfield Project
14 19 (1.18%) Public Cloud
15 18 (1.12%) Algorithms
15 18 (1.12%) Private Cloud
16 17 (1.05%) Enterprise Cloud
Operating Systems
1 161 (9.99%) Windows
2 69 (4.28%) Linux
3 67 (4.16%) Windows Server
4 31 (1.92%) Android
5 30 (1.86%) Apple iOS
6 25 (1.55%) Windows 10
7 17 (1.05%) Windows Server 2012
8 15 (0.93%) Unix
9 13 (0.81%) Red Hat Enterprise Linux
9 13 (0.81%) Windows 7
9 13 (0.81%) Windows 8
10 10 (0.62%) Oracle Linux
10 10 (0.62%) Solaris
11 7 (0.43%) VMS
12 2 (0.12%) CentOS
12 2 (0.12%) Ubuntu
12 2 (0.12%) Windows Server 2016
12 2 (0.12%) Windows Server 2019
13 1 (0.062%) Mac OS
13 1 (0.062%) Windows Server 2008
Processes & Methodologies
1 567 (35.17%) Agile
2 487 (30.21%) Problem-Solving
3 275 (17.06%) Mentoring
4 257 (15.94%) Project Management
5 254 (15.76%) DevOps
6 203 (12.59%) Coaching
7 196 (12.16%) Stakeholder Management
8 178 (11.04%) Scrum
9 176 (10.92%) Project Delivery
10 162 (10.05%) Business Intelligence
11 158 (9.80%) CI/CD
12 152 (9.43%) Customer Service
13 146 (9.06%) Analytics
14 145 (9.00%) Decision-Making
15 140 (8.68%) Software Engineering
16 131 (8.13%) Service Delivery
17 129 (8.00%) Change Management
18 128 (7.94%) Technical Leadership
19 122 (7.57%) ITIL
20 117 (7.26%) Collaborative Culture
Programming Languages
1 244 (15.14%) SQL
2 133 (8.25%) C#
3 124 (7.69%) Python
4 99 (6.14%) JavaScript
5 87 (5.40%) PowerShell
6 80 (4.96%) Java
7 59 (3.66%) T-SQL
8 50 (3.10%) TypeScript
9 33 (2.05%) Bash
10 26 (1.61%) PHP
11 25 (1.55%) Kotlin
12 18 (1.12%) VBA
13 15 (0.93%) C
14 14 (0.87%) RPG
15 13 (0.81%) Swift
16 12 (0.74%) C++
16 12 (0.74%) Perl
17 9 (0.56%) PL/SQL
17 9 (0.56%) R
18 8 (0.50%) VB.NET
Qualifications
1 317 (19.67%) Degree
2 81 (5.02%) Security Cleared
3 53 (3.29%) Computer Science Degree
4 45 (2.79%) PMI Certification
5 41 (2.54%) SC Cleared
6 33 (2.05%) PMP
7 32 (1.99%) Master's Degree
8 26 (1.61%) DBS Check
9 21 (1.30%) BPSS Clearance
10 19 (1.18%) Azure Certification
11 12 (0.74%) APMG
11 12 (0.74%) AWS Certification
11 12 (0.74%) Cisco Certification
11 12 (0.74%) CISSP
11 12 (0.74%) ISTQB
12 10 (0.62%) HND
13 9 (0.56%) ITIL Certification
14 8 (0.50%) CISM
14 8 (0.50%) Microsoft Certification
15 7 (0.43%) APMP
Quality Assurance & Compliance
1 183 (11.35%) QA
2 64 (3.97%) GDPR
3 50 (3.10%) PMO
4 48 (2.98%) ISO/IEC 27001
5 37 (2.30%) SLA
6 29 (1.80%) Accessibility
7 25 (1.55%) IFRS
8 23 (1.43%) ISO 9001
9 20 (1.24%) Cyber Essentials
10 17 (1.05%) Data Quality
11 14 (0.87%) NIST
12 13 (0.81%) ISO 14001
13 12 (0.74%) Actionable Recommendations
13 12 (0.74%) Good Clinical Practice
14 11 (0.68%) ISO 22301
15 9 (0.56%) PCI DSS
16 7 (0.43%) NEBOSH
17 6 (0.37%) IFRS 9
18 5 (0.31%) GRC
18 5 (0.31%) SOC 2
System Software
1 104 (6.45%) Docker
2 81 (5.02%) Active Directory
3 33 (2.05%) VMware ESXi
3 33 (2.05%) VMware Infrastructure
4 21 (1.30%) Virtual Machines
5 13 (0.81%) Virtual Desktop
6 10 (0.62%) vSphere
7 6 (0.37%) DFS Replication
8 4 (0.25%) Firmware
9 3 (0.19%) Hyper-V
10 2 (0.12%) Ceph
11 1 (0.062%) Snort
11 1 (0.062%) Varnish
Systems Management
1 105 (6.51%) Kubernetes
2 76 (4.71%) Terraform
3 48 (2.98%) Ansible
4 37 (2.30%) Grafana
5 35 (2.17%) Microsoft Intune
6 32 (1.99%) vCenter Server
7 23 (1.43%) Puppet
8 18 (1.12%) Single Sign-On
9 17 (1.05%) Prometheus
10 16 (0.99%) Microsoft Clustering
10 16 (0.99%) Nagios
11 10 (0.62%) Graphite
11 10 (0.62%) HAProxy
12 9 (0.56%) Active Directory Federation Services
13 6 (0.37%) FortiGate
13 6 (0.37%) NetBackup
13 6 (0.37%) SCCM
13 6 (0.37%) vRealize Orchestrator
14 5 (0.31%) Progress Chef
15 4 (0.25%) Salt
Vendors
1 367 (22.77%) Microsoft
2 71 (4.40%) ServiceNow
3 65 (4.03%) Google
4 62 (3.85%) Oracle
5 61 (3.78%) SAP
6 51 (3.16%) VMware
7 47 (2.92%) Databricks
8 35 (2.17%) Salesforce
9 19 (1.18%) Commvault
9 19 (1.18%) Sun
10 14 (0.87%) Cisco
11 12 (0.74%) Veeam
12 11 (0.68%) Atlassian
12 11 (0.68%) NEC
12 11 (0.68%) Xamarin
13 10 (0.62%) IBM
13 10 (0.62%) Infor
13 10 (0.62%) Remedy
13 10 (0.62%) Serena
14 9 (0.56%) Citrix