Leader
Cambridgeshire > Cambridge
The median Leader daily rate in Cambridge is £525, according to job vacancies posted in the 6 months leading up to 18 August 2025.
The table below provides contractor rate benchmarking and summary statistics, comparing them to the same period in the previous two years.
| 6 months to 18 Aug 2025 |
Same period 2024 | Same period 2023 | |
|---|---|---|---|
| Rank | 25 | 22 | 24 |
| Rank change year-on-year | -3 | +2 | +7 |
| Contract jobs requiring a Lead | 3 | 6 | 9 |
| As % of all contract jobs advertised in Cambridge | 1.80% | 3.68% | 3.85% |
| As % of the Job Titles category | 2.05% | 4.26% | 4.13% |
| Number of daily rates quoted | 3 | 2 | 7 |
| 10th Percentile | £483 | £380 | £463 |
| 25th Percentile | £494 | £425 | £481 |
| Median daily rate (50th Percentile) | £525 | £500 | £550 |
| Median % change year-on-year | +5.00% | -9.09% | +7.32% |
| 75th Percentile | £544 | £575 | £594 |
| 90th Percentile | £548 | £620 | £600 |
| Cambridgeshire median daily rate | £525 | £573 | £475 |
| % change year-on-year | -8.30% | +20.53% | -17.39% |
| Number of hourly rates quoted | 0 | 1 | 0 |
| Median hourly rate | - | £23.41 | - |
| Cambridgeshire median hourly rate | - | £25.54 | - |
All Contract IT Job Vacancies
Cambridge
For comparison with the information above, the following table provides summary statistics for all contract IT job vacancies in Cambridge. Most job vacancies include a discernible job title that can be normalized. As such, the figures in the second row provide an indication of the number of contract jobs in our overall sample.
| Contract vacancies in Cambridge with a recognized job title | 146 | 141 | 218 |
| % of contract IT jobs with a recognized job title | 87.43% | 86.50% | 93.16% |
| Number of daily rates quoted | 76 | 70 | 141 |
| 10th Percentile | £353 | £225 | £185 |
| 25th Percentile | £444 | £334 | £413 |
| Median daily rate (50th Percentile) | £525 | £420 | £465 |
| Median % change year-on-year | +25.00% | -9.68% | -2.11% |
| 75th Percentile | £625 | £550 | £538 |
| 90th Percentile | £713 | £639 | £588 |
| Cambridgeshire median daily rate | £500 | £425 | £450 |
| % change year-on-year | +17.65% | -5.56% | -5.26% |
| Number of hourly rates quoted | 7 | 18 | 17 |
| 10th Percentile | £16.88 | £22.53 | £15.50 |
| 25th Percentile | £38.90 | £36.06 | - |
| Median hourly rate | £60.00 | £52.50 | £17.72 |
| Median % change year-on-year | +14.29% | +196.28% | -59.73% |
| 75th Percentile | £71.25 | £63.75 | £53.75 |
| 90th Percentile | £80.00 | £67.13 | £61.75 |
| Cambridgeshire median hourly rate | £16.58 | £21.37 | £17.72 |
| % change year-on-year | -22.44% | +20.60% | +18.13% |
Lead
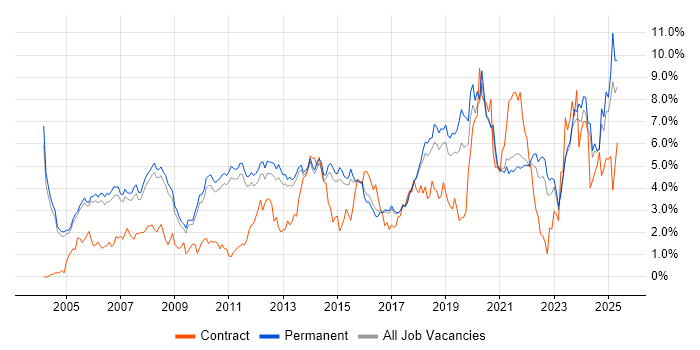
Job Vacancy Trend in Cambridge
Job postings that featured Lead in the job title as a proportion of all IT jobs advertised in Cambridge.

Lead
Contractor Daily Rate Trend in Cambridge
3-month moving average daily rate quoted in jobs citing Lead in Cambridge.
Lead
Contractor Hourly Rate Trend in Cambridge
3-month moving average hourly rates quoted in jobs citing Lead in Cambridge.
Lead Skill Set
Top 30 Co-occurring Skills and Capabilities in Cambridge
For the 6 months to 18 August 2025, Lead contract job roles required the following skills and capabilities in order of popularity. The figures indicate the absolute number co-occurrences and as a proportion of all contract job ads across the Cambridge region featuring Lead in the job title.
|
|
Lead Skill Set
Co-occurring Skills and Capabilities in Cambridge by Category
The follow tables expand on the table above by listing co-occurrences grouped by category. The same employment type, locality and period is covered with up to 20 co-occurrences shown in each of the following categories:
