Line Management
Kensington and Chelsea > Kensington
The table below provides summary statistics for contract job vacancies advertised in Kensington requiring Line Management skills. It includes a benchmarking guide to the contractor rates offered in vacancies that cited Line Management over the 6 months leading up to 17 May 2025, comparing them to the same period in the previous two years.
| 6 months to 17 May 2025 |
Same period 2024 | Same period 2023 | |
|---|---|---|---|
| Rank | - | 3 | - |
| Rank change year-on-year | - | - | - |
| Contract jobs citing Line Management | 0 | 1 | 0 |
| As % of all contract jobs advertised in Kensington | - | 11.11% | - |
| As % of the Processes & Methodologies category | - | 12.50% | - |
| Number of daily rates quoted | 0 | 1 | 0 |
| Median daily rate (50th Percentile) | - | £400 | - |
| Kensington and Chelsea median daily rate | - | £400 | - |
All Process and Methodology Skills
Kensington
Line Management falls under the Processes and Methodologies category. For comparison with the information above, the following table provides summary statistics for all contract job vacancies requiring process or methodology skills in Kensington.
| Contract vacancies with a requirement for process or methodology skills | 2 | 8 | 0 |
| As % of all contract IT jobs advertised in Kensington | 100.00% | 88.89% | - |
| Number of daily rates quoted | 0 | 4 | 0 |
| Median daily rate (50th Percentile) | - | £231 | - |
| Kensington and Chelsea median daily rate | - | £231 | - |
| Number of hourly rates quoted | 2 | 3 | 0 |
| Median hourly rate | £29.07 | £26.56 | - |
| Median % change year-on-year | +9.45% | - | - |
| Kensington and Chelsea median hourly rate | £29.07 | £26.56 | - |
| % change year-on-year | +9.45% | - | - |
Line Management
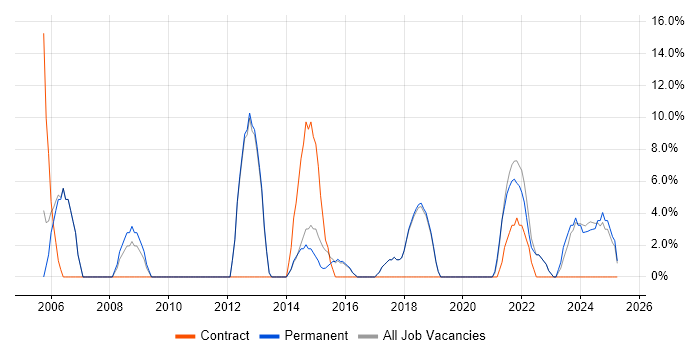
Job Vacancy Trend in Kensington
Job postings citing Line Management as a proportion of all IT jobs advertised in Kensington.

