Tricentis qTest
Scotland > Lanarkshire
The table below provides summary statistics and contractor rates for jobs advertised in Lanarkshire requiring Tricentis qTest skills. It covers contract job vacancies from the 6 months leading up to 2 August 2026, with comparisons to the same periods in the previous two years.
|
|
6 months to
2 Aug 2026 |
Same period 2025 |
Same period 2024 |
| Rank |
4 |
- |
4 |
| Rank change year-on-year |
- |
- |
- |
| Contract jobs citing Tricentis qTest |
1 |
0 |
1 |
| As % of all contract jobs in Lanarkshire |
14.29% |
- |
6.25% |
| As % of the Development Applications category |
100.00% |
- |
50.00% |
| Number of daily rates quoted |
0 |
0 |
1 |
| Median daily rate (50th Percentile) |
- |
- |
£400 |
| Scotland median daily rate |
- |
£550 |
£400 |
| % change year-on-year |
- |
+37.50% |
- |
Tricentis qTest falls under the Development Applications category. For comparison with the information above, the following table provides summary statistics for all contract job vacancies requiring development application skills in Lanarkshire.
| Contract vacancies with a requirement for development application skills |
1 |
0 |
2 |
| As % of all contract IT jobs advertised in Lanarkshire |
14.29% |
- |
12.50% |
| Number of daily rates quoted |
0 |
0 |
2 |
| 10th Percentile |
- |
- |
£406 |
| 25th Percentile |
- |
- |
£414 |
| Median daily rate (50th Percentile) |
- |
- |
£430 |
| Median % change year-on-year |
- |
- |
-10.23% |
| 75th Percentile |
- |
- |
£449 |
| 90th Percentile |
- |
- |
£459 |
| Scotland median daily rate |
£429 |
£475 |
£475 |
| % change year-on-year |
-9.74% |
- |
- |
Tricentis qTest
Job Vacancy Trend in Lanarkshire
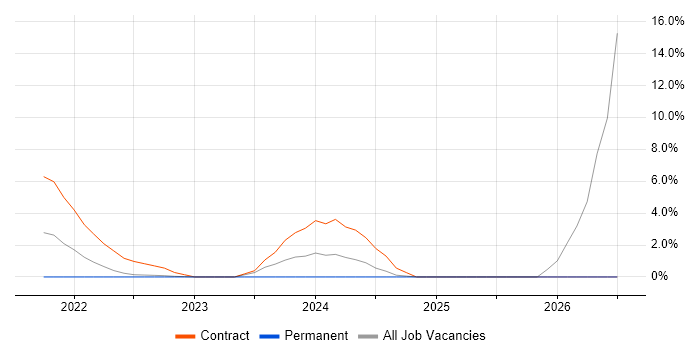
Historical trend showing the proportion of contract IT job postings citing Tricentis qTest relative to all contract IT jobs advertised in Lanarkshire.
Tricentis qTest
Daily Rate Trend in Lanarkshire
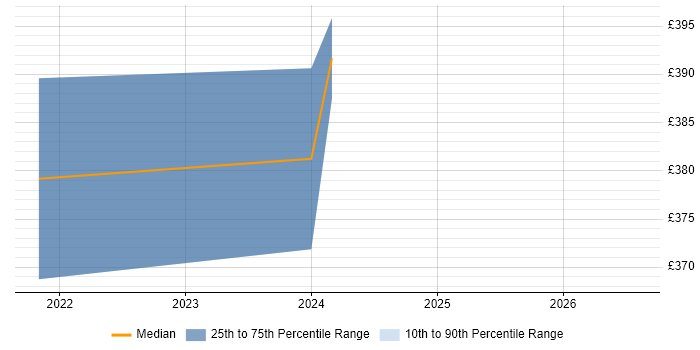
Contractor daily rate distribution trend for jobs in Lanarkshire citing Tricentis qTest.
Tricentis qTest
Co-Occurring Skills & Capabilities in Lanarkshire by Category
The following tables expand on the one above by listing co-occurrences grouped by category. They cover the same employment type, locality and period, with up to 20 co-occurrences shown in each category: