SAP FICO
London > North London
The table below provides summary statistics and contractor rates for jobs advertised in North London requiring SAP FI/CO skills. It covers contract job vacancies from the 6 months leading up to 4 August 2026, with comparisons to the same periods in the previous two years.
|
|
6 months to
4 Aug 2026 |
Same period 2025 |
Same period 2024 |
| Rank |
10 |
- |
- |
| Rank change year-on-year |
- |
- |
- |
| Contract jobs citing SAP FI/CO |
1 |
0 |
0 |
| As % of all contract jobs in North London |
3.85% |
- |
- |
| As % of the Business Applications category |
25.00% |
- |
- |
| Number of daily rates quoted |
0 |
0 |
0 |
| Median daily rate (50th Percentile) |
- |
- |
- |
| London median daily rate |
£710 |
£588 |
£500 |
| % change year-on-year |
+20.85% |
+17.50% |
-18.70% |
SAP FI/CO falls under the Business Applications category. For comparison with the information above, the following table provides summary statistics for all contract job vacancies requiring business application skills in North London.
| Contract vacancies with a requirement for business application skills |
4 |
3 |
2 |
| As % of all contract IT jobs advertised in North London |
15.38% |
14.29% |
10.53% |
| Number of daily rates quoted |
2 |
3 |
2 |
| 10th Percentile |
£434 |
£370 |
£530 |
| 25th Percentile |
£448 |
£438 |
£530 |
| Median daily rate (50th Percentile) |
£494 |
£600 |
£561 |
| Median % change year-on-year |
-17.71% |
+6.90% |
+15.13% |
| 75th Percentile |
£536 |
£800 |
£593 |
| 90th Percentile |
£548 |
£890 |
£593 |
| London median daily rate |
£567 |
£567 |
£575 |
| % change year-on-year |
+0.04% |
-1.48% |
-4.17% |
SAP FI/CO
Job Vacancy Trend in North London
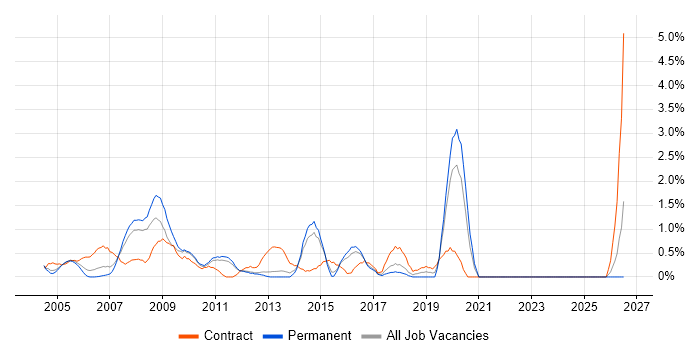
Historical trend showing the proportion of contract IT job postings citing SAP FI/CO relative to all contract IT jobs advertised in North London.
SAP FI/CO
Daily Rate Trend in North London
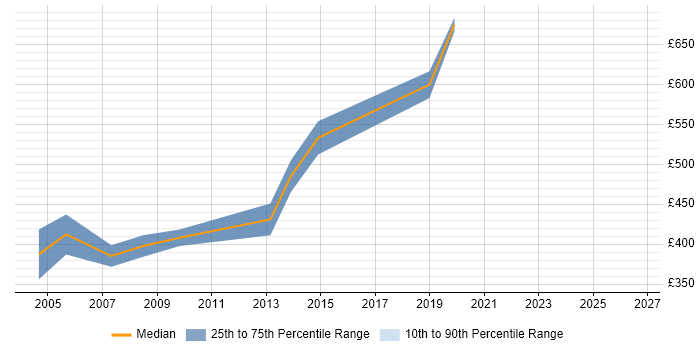
Contractor daily rate distribution trend for jobs in North London citing SAP FI/CO.
SAP FI/CO
Co-Occurring Skills & Capabilities in North London by Category
The following tables expand on the one above by listing co-occurrences grouped by category. They cover the same employment type, locality and period, with up to 20 co-occurrences shown in each category: