Developer
Northamptonshire > Northampton
The median Developer daily rate in Northampton is £358, according to job vacancies posted in the 6 months leading up to 4 June 2025.
The table below provides contractor rate benchmarking and summary statistics, comparing them to the same period in the previous two years.
| 6 months to 4 Jun 2025 |
Same period 2024 | Same period 2023 | |
|---|---|---|---|
| Rank | 14 | 18 | 12 |
| Rank change year-on-year | +4 | -6 | -5 |
| Contract jobs requiring a Developer | 23 | 14 | 10 |
| As % of all contract jobs advertised in Northampton | 11.98% | 7.53% | 8.20% |
| As % of the Job Titles category | 12.78% | 7.73% | 8.93% |
| Number of daily rates quoted | 16 | 12 | 9 |
| 10th Percentile | £292 | £390 | £283 |
| 25th Percentile | £323 | £405 | - |
| Median daily rate (50th Percentile) | £358 | £514 | £300 |
| Median % change year-on-year | -30.32% | +71.25% | -33.33% |
| 75th Percentile | £373 | £588 | £400 |
| 90th Percentile | £402 | £599 | £415 |
| Northamptonshire median daily rate | £358 | £425 | £381 |
| % change year-on-year | -15.76% | +11.48% | -15.28% |
All Contract IT Job Vacancies
Northampton
For comparison with the information above, the following table provides summary statistics for all contract IT job vacancies in Northampton. Most job vacancies include a discernible job title that can be normalized. As such, the figures in the second row provide an indication of the number of contract jobs in our overall sample.
| Contract vacancies in Northampton with a recognized job title | 180 | 181 | 112 |
| % of contract IT jobs with a recognized job title | 93.75% | 97.31% | 91.80% |
| Number of daily rates quoted | 151 | 144 | 86 |
| 10th Percentile | £256 | £355 | £198 |
| 25th Percentile | £340 | £375 | £303 |
| Median daily rate (50th Percentile) | £390 | £450 | £400 |
| Median % change year-on-year | -13.33% | +12.50% | -12.81% |
| 75th Percentile | £474 | £575 | £500 |
| 90th Percentile | £525 | £620 | £606 |
| Northamptonshire median daily rate | £400 | £445 | £400 |
| % change year-on-year | -10.11% | +11.25% | -11.11% |
| Number of hourly rates quoted | 5 | 6 | 1 |
| 10th Percentile | £16.81 | - | - |
| 25th Percentile | - | - | - |
| Median hourly rate | £21.39 | £14.00 | £14.52 |
| Median % change year-on-year | +52.79% | -3.58% | +7.56% |
| 75th Percentile | - | - | - |
| 90th Percentile | - | £35.75 | - |
| Northamptonshire median hourly rate | £21.39 | £14.00 | £21.38 |
| % change year-on-year | +52.79% | -34.50% | -24.84% |
Developer
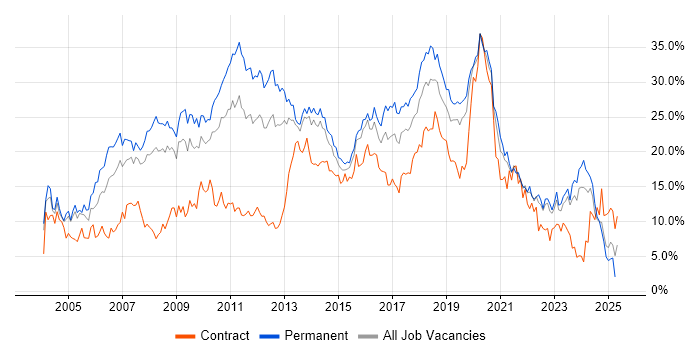
Job Vacancy Trend in Northampton
Job postings that featured Developer in the job title as a proportion of all IT jobs advertised in Northampton.

Developer
Contractor Daily Rate Trend in Northampton
3-month moving average daily rate quoted in jobs citing Developer in Northampton.
Developer
Daily Rate Histogram in Northampton
Daily rate distribution for jobs citing Developer in Northampton over the 6 months to 4 June 2025.
Developer
Contractor Hourly Rate Trend in Northampton
3-month moving average hourly rates quoted in jobs citing Developer in Northampton.
Developer Skill Set
Top 30 Co-occurring Skills and Capabilities in Northampton
For the 6 months to 4 June 2025, Developer contract job roles required the following skills and capabilities in order of popularity. The figures indicate the absolute number co-occurrences and as a proportion of all contract job ads across the Northampton region featuring Developer in the job title.
|
|
Developer Skill Set
Co-occurring Skills and Capabilities in Northampton by Category
The follow tables expand on the table above by listing co-occurrences grouped by category. The same employment type, locality and period is covered with up to 20 co-occurrences shown in each of the following categories:
|
|
||||||||||||||||||||||||||||||||||||||||||||||||||||||||||||||||||||||||||||||||||||||||||||||||||||||||||||||||||||||||
|
|
||||||||||||||||||||||||||||||||||||||||||||||||||||||||||||||||||||||||||||||||||||||||||||||||||||||||||||||||||||||||
|
|
||||||||||||||||||||||||||||||||||||||||||||||||||||||||||||||||||||||||||||||||||||||||||||||||||||||||||||||||||||||||
|
|
||||||||||||||||||||||||||||||||||||||||||||||||||||||||||||||||||||||||||||||||||||||||||||||||||||||||||||||||||||||||
|
|
||||||||||||||||||||||||||||||||||||||||||||||||||||||||||||||||||||||||||||||||||||||||||||||||||||||||||||||||||||||||
|
|
||||||||||||||||||||||||||||||||||||||||||||||||||||||||||||||||||||||||||||||||||||||||||||||||||||||||||||||||||||||||
|
|
||||||||||||||||||||||||||||||||||||||||||||||||||||||||||||||||||||||||||||||||||||||||||||||||||||||||||||||||||||||||
|
|
||||||||||||||||||||||||||||||||||||||||||||||||||||||||||||||||||||||||||||||||||||||||||||||||||||||||||||||||||||||||
|
|||||||||||||||||||||||||||||||||||||||||||||||||||||||||||||||||||||||||||||||||||||||||||||||||||||||||||||||||||||||||
