Power Platform Contract Job Trends in Warwick

Microsoft Power Platform
Warwickshire > Warwick

The table below provides summary statistics and contractor rates for jobs advertised in Warwick requiring Power Platform skills. It covers vacancies from the 6 months leading up to 25 September 2025, with comparisons to the same periods in the previous two years.

6 months to
25 Sep 2025
Same period 2024 Same period 2023
Rank 20 33 23
Rank change year-on-year +13 -10 -4
Contract jobs citing Power Platform 19 5 4
As % of all contract jobs advertised in Warwick 6.48% 2.56% 2.58%
As % of the Cloud Services category 22.09% 8.77% 8.51%
Number of daily rates quoted 11 3 2
10th Percentile £300 - £378
25th Percentile £368 £363 £419
Median daily rate (50th Percentile) £425 £375 £500
Median % change year-on-year +13.33% -25.00% -13.04%
75th Percentile £513 £519 £594
90th Percentile £538 £598 £643
Warwickshire median daily rate £500 £450 £544
% change year-on-year +11.11% -17.24% +8.75%

All Cloud Skills
Warwick

Power Platform falls under the Cloud Services category. For comparison with the information above, the following table provides summary statistics for all contract job vacancies requiring cloud computing skills in Warwick.

Contract vacancies with a requirement for cloud computing skills 86 57 47
As % of all contract IT jobs advertised in Warwick 29.35% 29.23% 30.32%
Number of daily rates quoted 59 24 35
10th Percentile £350 £332 £141
25th Percentile £442 £400 £168
Median daily rate (50th Percentile) £550 £500 £588
Median % change year-on-year +10.00% -14.89% +20.51%
75th Percentile £594 £591 £681
90th Percentile £658 £630 £758
Warwickshire median daily rate £550 £563 £563
% change year-on-year -2.22% - +12.50%
Number of hourly rates quoted 0 1 0
Median hourly rate - £33.54 -
Warwickshire median hourly rate £34.98 £34.27 -
% change year-on-year +2.07% - -

Power Platform
Job Vacancy Trend in Warwick

Job postings citing Power Platform as a proportion of all IT jobs advertised in Warwick.
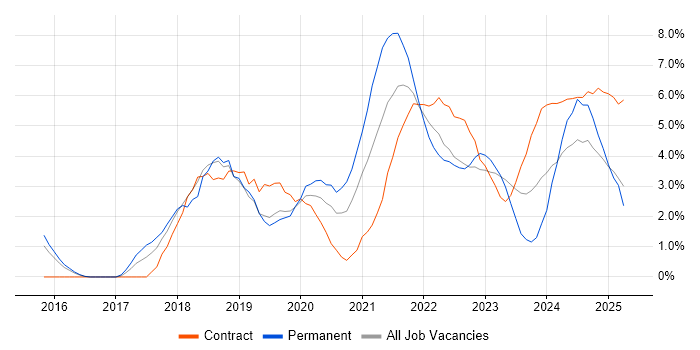
Job vacancy trend for Power Platform in Warwick

Power Platform
Daily Rate Trend in Warwick

Contractor daily rate distribution trend for jobs in Warwick citing Power Platform.

Contractor daily rate distribution trend for jobs in Warwick citing Power Platform

Power Platform
Daily Rate Histogram in Warwick

Daily rate distribution for jobs citing Power Platform in Warwick over the 6 months to 25 September 2025.

Daily rate histogram for Power Platform in Warwick

Power Platform
Co-occurring Skills and Capabilities in Warwick by Category

The follow tables expand on the table above by listing co-occurrences grouped by category. The same employment type, locality and period is covered with up to 20 co-occurrences shown in each of the following categories:

Application Platforms
1 9 (47.37%) SharePoint
2 3 (15.79%) Microsoft Exchange
3 1 (5.26%) Apache Spark
3 1 (5.26%) Confluence
Applications
1 7 (36.84%) Microsoft Excel
2 3 (15.79%) Microsoft Project
2 3 (15.79%) MS Visio
3 2 (10.53%) Microsoft Office
3 2 (10.53%) Microsoft PowerPoint
Business Applications
1 2 (10.53%) Dynamics CRM
Cloud Services
1 8 (42.11%) PowerApps
2 6 (31.58%) Power Automate
3 4 (21.05%) Microsoft 365
4 3 (15.79%) Copilot Studio
4 3 (15.79%) Dynamics 365
4 3 (15.79%) Viva Engage
5 2 (10.53%) SaaS
6 1 (5.26%) Azure
6 1 (5.26%) Azure Data Factory
6 1 (5.26%) Azure Synapse Analytics
6 1 (5.26%) Matillion
6 1 (5.26%) Snowflake
Communications & Networking
1 1 (5.26%) Internet
Database & Business Intelligence
1 14 (73.68%) Power BI
2 3 (15.79%) Data Warehouse
3 2 (10.53%) Metadata
3 2 (10.53%) Relational Database
3 2 (10.53%) Tableau
4 1 (5.26%) Big Data
4 1 (5.26%) Data Lake
4 1 (5.26%) Hadoop
4 1 (5.26%) NoSQL
4 1 (5.26%) SQL Server Integration Services
Development Applications
1 6 (31.58%) JIRA
General
1 7 (36.84%) Social Skills
2 5 (26.32%) Analytical Skills
3 2 (10.53%) Organisational Skills
3 2 (10.53%) Presentation Skills
4 1 (5.26%) Finance
Job Titles
1 5 (26.32%) Analyst
2 4 (21.05%) Administrator
3 3 (15.79%) Architect
3 3 (15.79%) JIRA Administrator
4 2 (10.53%) Business Performance Analyst
4 2 (10.53%) Data Analyst
4 2 (10.53%) Dynamics 365 Architect
4 2 (10.53%) Performance Analyst
5 1 (5.26%) Automation Developer
5 1 (5.26%) CRM Architect
5 1 (5.26%) Data Engineer
5 1 (5.26%) Data Scientist
5 1 (5.26%) Defect Manager
5 1 (5.26%) Lead
5 1 (5.26%) Microsoft 365 Administrator
5 1 (5.26%) Microsoft 365 Consultant
5 1 (5.26%) Microsoft 365 Specialist
5 1 (5.26%) Migration Specialist
5 1 (5.26%) Power Apps Developer
5 1 (5.26%) Report Analyst
Libraries, Frameworks & Software Standards
1 3 (15.79%) REST
2 2 (10.53%) .NET
3 1 (5.26%) Kafka
Miscellaneous
1 2 (10.53%) Data Structures
1 2 (10.53%) SCADA
2 1 (5.26%) Algorithms
2 1 (5.26%) Data Fabric
2 1 (5.26%) IoT
2 1 (5.26%) Legacy Systems
2 1 (5.26%) Management Information System
Processes & Methodologies
1 13 (68.42%) Business Intelligence
2 7 (36.84%) Migration
3 6 (31.58%) Data Modelling
4 5 (26.32%) Decision-Making
4 5 (26.32%) Stakeholder Management
5 4 (21.05%) Agile
5 4 (21.05%) Data Management
5 4 (21.05%) Visualisation
6 3 (15.79%) Actionable Insight
6 3 (15.79%) Data Analysis
6 3 (15.79%) Data Governance
6 3 (15.79%) Enterprise Architecture
6 3 (15.79%) ETL
6 3 (15.79%) Requirements Gathering
6 3 (15.79%) Validation
6 3 (15.79%) Webhook
7 2 (10.53%) Compliance Management
7 2 (10.53%) Data Collection
7 2 (10.53%) Data Engineering
7 2 (10.53%) Machine Learning
Programming Languages
1 5 (26.32%) SQL
2 3 (15.79%) Python
3 2 (10.53%) Data Analysis Expressions
3 2 (10.53%) JavaScript
3 2 (10.53%) PowerShell
4 1 (5.26%) R
4 1 (5.26%) VBA
Qualifications
1 4 (21.05%) SC Cleared
1 4 (21.05%) Security Cleared
2 1 (5.26%) Computer Science Degree
2 1 (5.26%) Degree
2 1 (5.26%) Master's Degree
Quality Assurance & Compliance
1 4 (21.05%) Data Quality
2 1 (5.26%) Accessibility
Systems Management
1 3 (15.79%) Single Sign-On
Vendors
1 3 (15.79%) Atlassian
1 3 (15.79%) Microsoft
2 2 (10.53%) OpenText
2 2 (10.53%) SAP
3 1 (5.26%) Ariba
3 1 (5.26%) Databricks
3 1 (5.26%) Informatica