Business Intelligence Contract Job Trends in Yorkshire

Business Intelligence (BI)
England > Yorkshire

The table below provides summary statistics and contractor rates for jobs advertised in Yorkshire requiring Business Intelligence skills. It covers contract job vacancies from the 6 months leading up to 21 November 2025, with comparisons to the same periods in the previous two years.

6 months to
21 Nov 2025
Same period 2024 Same period 2023
Rank 58 37 59
Rank change year-on-year -21 +22 -24
Contract jobs citing Business Intelligence 78 61 51
As % of all contract jobs in Yorkshire 4.30% 4.55% 2.72%
As % of the Processes & Methodologies category 4.77% 5.35% 3.07%
Number of daily rates quoted 54 42 42
10th Percentile £273 £332 £281
25th Percentile £352 £413 £350
Median daily rate (50th Percentile) £450 £485 £438
Median % change year-on-year -7.22% +10.86% -24.57%
75th Percentile £538 £549 £547
90th Percentile £596 £567 £624
England median daily rate £500 £500 £500
% change year-on-year - - -4.76%
Number of hourly rates quoted 0 3 1
10th Percentile - - -
25th Percentile - £26.25 £15.32
Median hourly rate - £27.50 £16.11
Median % change year-on-year - +70.70% -
75th Percentile - £31.25 £16.90
90th Percentile - £32.75 -
England median hourly rate £23.75 £30.30 £32.32
% change year-on-year -21.60% -6.27% -4.94%

All Process and Methodology Skills
Yorkshire

Business Intelligence falls under the Processes and Methodologies category. For comparison with the information above, the following table provides summary statistics for all contract job vacancies requiring process or methodology skills in Yorkshire.

Contract vacancies with a requirement for process or methodology skills 1,634 1,140 1,662
As % of all contract IT jobs advertised in Yorkshire 90.08% 84.95% 88.64%
Number of daily rates quoted 1,088 656 1,072
10th Percentile £250 £246 £300
25th Percentile £375 £400 £413
Median daily rate (50th Percentile) £480 £500 £508
Median % change year-on-year -4.00% -1.57% +1.60%
75th Percentile £550 £575 £600
90th Percentile £649 £681 £688
England median daily rate £505 £525 £545
% change year-on-year -3.81% -3.67% -0.91%
Number of hourly rates quoted 52 38 25
10th Percentile £15.03 - £15.96
25th Percentile £18.74 £12.55 £18.50
Median hourly rate £25.08 £19.50 £22.00
Median % change year-on-year +28.59% -11.36% +7.32%
75th Percentile £25.49 £33.75 £30.00
90th Percentile £78.63 £41.50 £44.30
England median hourly rate £25.15 £37.00 £44.50
% change year-on-year -32.03% -16.85% +23.61%

Business Intelligence
Job Vacancy Trend in Yorkshire

Historical trend showing the proportion of contract IT job postings citing Business Intelligence relative to all contract IT jobs advertised in Yorkshire.
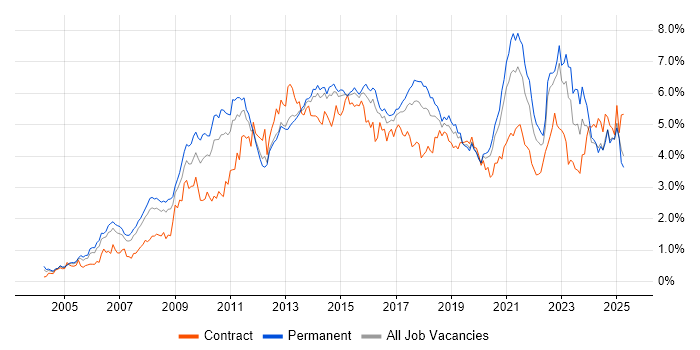
Business Intelligence job vacancy trend in Yorkshire

Business Intelligence
Daily Rate Trend in Yorkshire

Contractor daily rate distribution trend for jobs in Yorkshire citing Business Intelligence.

Contractor daily rate distribution trend for jobs in Yorkshire citing Business Intelligence

Business Intelligence
Daily Rate Histogram in Yorkshire

Daily rate distribution for jobs citing Business Intelligence in Yorkshire over the 6 months to 21 November 2025.

Daily rate histogram for Business Intelligence in Yorkshire

Business Intelligence
Hourly Rate Trend in Yorkshire

Contractor hourly rate distribution trend for jobs in Yorkshire citing Business Intelligence.

Contractor hourly rate distribution trend for jobs in Yorkshire citing Business Intelligence

Business Intelligence
Contract Job Locations in Yorkshire

The table below looks at the demand and provides a guide to the median contractor rates quoted in IT jobs citing Business Intelligence within the Yorkshire region over the 6 months to 21 November 2025. The 'Rank Change' column provides an indication of the change in demand within each location based on the same 6 month period last year.

Location Rank Change
on Same Period
Last Year
Matching
Contract
IT Job Ads
Median
Daily Rate
Past 6 Months
Median Daily Rate
% Change
on Same Period
Last Year
Live
Jobs
West Yorkshire -5 42 £513 +13.89% 56
South Yorkshire -30 34 £367 -30.10% 12
North Yorkshire +3 2 - - 6
Business Intelligence
England

Business Intelligence
Co-Occurring Skills & Capabilities in Yorkshire by Category

The following tables expand on the one above by listing co-occurrences grouped by category. They cover the same employment type, locality and period, with up to 20 co-occurrences shown in each category:

Application Platforms
1 11 (14.10%) SharePoint
2 3 (3.85%) Confluence
3 2 (2.56%) Apache Airflow
Applications
1 34 (43.59%) Microsoft Excel
2 6 (7.69%) Microsoft PowerPoint
3 4 (5.13%) Spreadsheet
4 2 (2.56%) Maple
4 2 (2.56%) MS Visio
5 1 (1.28%) Microsoft Office
5 1 (1.28%) Microsoft Project
Business Applications
1 5 (6.41%) SAP S/4HANA
2 3 (3.85%) Oracle EBS
3 2 (2.56%) Cloudability
3 2 (2.56%) Dynamics CRM
4 1 (1.28%) SAP MRS
4 1 (1.28%) SAP PM
Cloud Services
1 63 (80.77%) Power Platform
2 18 (23.08%) Azure
3 11 (14.10%) Power Automate
4 10 (12.82%) PowerApps
5 8 (10.26%) GCP
6 7 (8.97%) AWS
7 6 (7.69%) Azure DevOps
7 6 (7.69%) Dynamics 365
8 5 (6.41%) Snowflake
9 4 (5.13%) Entra ID
10 3 (3.85%) Azure Synapse Analytics
10 3 (3.85%) Microsoft 365
11 2 (2.56%) Azure Data Factory
11 2 (2.56%) Azure Logic Apps
11 2 (2.56%) Collibra
11 2 (2.56%) dbt
11 2 (2.56%) GitHub
11 2 (2.56%) GitHub Actions
11 2 (2.56%) Google Analytics
11 2 (2.56%) OCI
Communications & Networking
1 1 (1.28%) HTTP
1 1 (1.28%) VPN
1 1 (1.28%) Wi-Fi
Database & Business Intelligence
1 63 (80.77%) Power BI
2 18 (23.08%) Power Query
3 13 (16.67%) Tableau
4 10 (12.82%) Data Warehouse
5 7 (8.97%) Oracle Reports
5 7 (8.97%) PowerPivot
6 6 (7.69%) BigQuery
7 5 (6.41%) Looker
7 5 (6.41%) SQL Server
8 3 (3.85%) Azure SQL Database
8 3 (3.85%) Metadata
9 2 (2.56%) Data Lake
9 2 (2.56%) MS Access
9 2 (2.56%) Relational Database
10 1 (1.28%) Amazon Athena
10 1 (1.28%) Ataccama
10 1 (1.28%) BusinessObjects
10 1 (1.28%) DB2
10 1 (1.28%) Delta Lake
10 1 (1.28%) Electronic Patient Records
Development Applications
1 4 (5.13%) JIRA
1 4 (5.13%) Oracle Forms
2 2 (2.56%) Git
3 1 (1.28%) Artifactory
3 1 (1.28%) Jenkins
3 1 (1.28%) Postman
3 1 (1.28%) Sonatype Nexus
3 1 (1.28%) SQL Server Management Studio (SSMS)
3 1 (1.28%) Visual Studio
General
1 39 (50.00%) Social Skills
2 28 (35.90%) Analytical Skills
3 27 (34.62%) Finance
4 22 (28.21%) Public Sector
5 13 (16.67%) Banking
6 5 (6.41%) Manufacturing
6 5 (6.41%) Presentation Skills
7 4 (5.13%) Billing
7 4 (5.13%) Marketing
8 3 (3.85%) Electronics
8 3 (3.85%) Telecoms
9 2 (2.56%) Documentation Skills
9 2 (2.56%) Local Government
9 2 (2.56%) Military
9 2 (2.56%) Retail
10 1 (1.28%) Environmental Health
10 1 (1.28%) Financial Institution
10 1 (1.28%) Law
10 1 (1.28%) Legal
10 1 (1.28%) Organisational Skills
Job Titles
1 32 (41.03%) Analyst
2 21 (26.92%) Data Analyst
3 11 (14.10%) Developer
4 7 (8.97%) Consultant
5 6 (7.69%) Strategy Analyst
6 5 (6.41%) Business Intelligence Developer
6 5 (6.41%) Lead
6 5 (6.41%) Report Analyst
6 5 (6.41%) Senior
7 4 (5.13%) Data Engineer
8 3 (3.85%) Business Analyst
8 3 (3.85%) Business Intelligence Analyst
8 3 (3.85%) Customer Analyst
8 3 (3.85%) Customer Experience Analyst
8 3 (3.85%) Power BI Developer
8 3 (3.85%) Power Platform Developer
8 3 (3.85%) SAP Consultant
8 3 (3.85%) Senior Analyst
8 3 (3.85%) Senior Data Analyst
9 2 (2.56%) Report Specialist
Libraries, Frameworks & Software Standards
1 4 (5.13%) Oracle Fusion
2 3 (3.85%) PySpark
3 2 (2.56%) .NET
3 2 (2.56%) CSS
3 2 (2.56%) HTML
3 2 (2.56%) REST
4 1 (1.28%) BAPI
4 1 (1.28%) Great Expectations
4 1 (1.28%) JSON
4 1 (1.28%) Middleware
4 1 (1.28%) OAuth
4 1 (1.28%) OAuth2
4 1 (1.28%) RESTful
4 1 (1.28%) SAP Fiori
4 1 (1.28%) Web Services
4 1 (1.28%) WebSockets
4 1 (1.28%) XML
Miscellaneous
1 9 (11.54%) Data Centre
2 7 (8.97%) Legacy Systems
3 4 (5.13%) Mainframe
4 2 (2.56%) Analytical Mindset
4 2 (2.56%) NHS
5 1 (1.28%) Foreign Exchange (FX)
5 1 (1.28%) Low-Code
5 1 (1.28%) Management Information System
5 1 (1.28%) Mobile App
5 1 (1.28%) Reference Data
5 1 (1.28%) Web Conferencing
Operating Systems
1 3 (3.85%) Windows
1 3 (3.85%) Windows 10
Processes & Methodologies
1 32 (41.03%) Visualisation
2 30 (38.46%) Analytics
3 26 (33.33%) Problem-Solving
4 25 (32.05%) Data Modelling
5 23 (29.49%) Data Analysis
6 22 (28.21%) Data Visualisation
7 20 (25.64%) Actionable Insight
7 20 (25.64%) Decision-Making
8 19 (24.36%) Data Governance
9 15 (19.23%) Stakeholder Management
10 14 (17.95%) Agile
11 10 (12.82%) Dashboard Development
11 10 (12.82%) Data Extraction
11 10 (12.82%) Data Management
11 10 (12.82%) ETL
11 10 (12.82%) Stakeholder Engagement
12 9 (11.54%) Migration
13 8 (10.26%) DevOps
13 8 (10.26%) Risk Analytics
13 8 (10.26%) Strategic Planning
Programming Languages
1 44 (56.41%) SQL
2 20 (25.64%) Python
3 10 (12.82%) VBA
4 7 (8.97%) Data Analysis Expressions
5 4 (5.13%) C#
5 4 (5.13%) JavaScript
6 2 (2.56%) PowerShell
7 1 (1.28%) ABAP
7 1 (1.28%) Groovy
7 1 (1.28%) Java
7 1 (1.28%) PL/SQL
7 1 (1.28%) R
Qualifications
1 7 (8.97%) Security Cleared
2 2 (2.56%) Microsoft Certification
3 1 (1.28%) SC Cleared
Quality Assurance & Compliance
1 13 (16.67%) Data Quality
2 4 (5.13%) Accessibility
2 4 (5.13%) GDPR
2 4 (5.13%) PMO
3 2 (2.56%) QA
3 2 (2.56%) Sarbanes-Oxley
4 1 (1.28%) California Consumer Privacy Act
4 1 (1.28%) COSHH
4 1 (1.28%) SLA
System Software
1 3 (3.85%) Active Directory
2 1 (1.28%) Docker
Systems Management
1 2 (2.56%) Terraform
2 1 (1.28%) Ansible
2 1 (1.28%) Kubernetes
2 1 (1.28%) Microsoft Intune
2 1 (1.28%) Single Sign-On
Vendors
1 20 (25.64%) Microsoft
2 8 (10.26%) Oracle
2 8 (10.26%) SAP
3 4 (5.13%) Google
4 3 (3.85%) Databricks
4 3 (3.85%) Salesforce
5 2 (2.56%) Computacenter
6 1 (1.28%) Hotjar
6 1 (1.28%) IFS
6 1 (1.28%) Informatica
6 1 (1.28%) MuleSoft
6 1 (1.28%) OpenAI
6 1 (1.28%) Optimizely
6 1 (1.28%) Palantir
6 1 (1.28%) ServiceNow
6 1 (1.28%) Splunk